analytics1_1
Technical Analysis of Solana Cryptocurrency Intraday Price Movement. Friday, April 24, 2026
Technical Analysis of Solana Cryptocurrency Intraday Price Movement. Friday, April 24, 2026
Crypto-currencies
2026-04-24 03:36:03
Solana
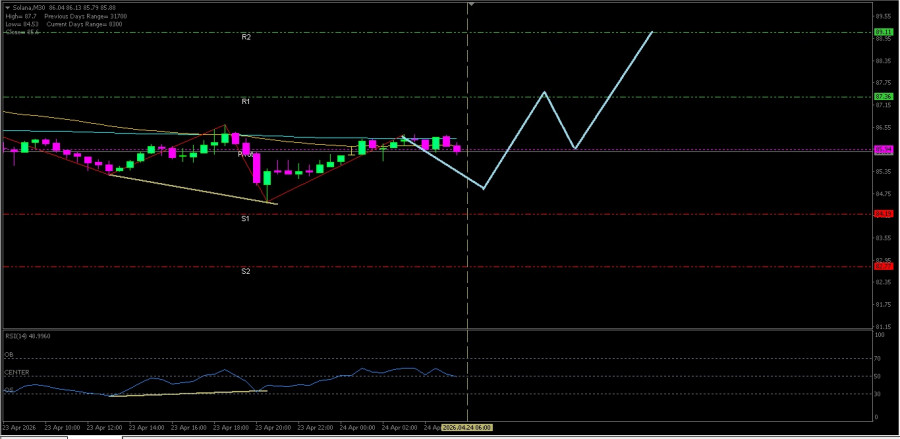
Although EMA(50) position is below EMA(200), but with RSI(14) condition is in the Neutral-Bullish level and the appearance of a Bullish Divergence, there is potential for Solana to strengthen toward its nearest resistance level.
Key Levels
1. Resistance. 2 : 89.11
2. Resistance. 1 : 87.36
3. Pivot : 85.94
4. Support. 1 : 84.19
5. Support. 2 : 82.77
Tactical Scenario
Positive Reaction Zone: If Solana breaks out above 87.36, there is a likelihood of a move up toward 89.11.
Momentum Extension Bias: If 89.11 is broken, 90.53 becomes the next target.
Invalidation Level / Bias Revision
The upside bias weakens if Solana falls below 82.77.
Technical Summary
EMA(50) : 86.05
EMA(200): 86.24
RSI(14) : 52.31 + Bullish Divergent
Economic News Release Agenda:
From the United States only two economic releases are scheduled:
US - Revised UoM Consumer Sentiment - 21:00 WIB
US - Revised UoM Inflation Expectations - 21:00 WIB
Смотрите также