
analytics1_1

Overview of GBP/USD Pair: December 30 - The Holidays Continue, and the Pound Tries to Confuse Traders
Overview of GBP/USD Pair: December 30 - The Holidays Continue, and the Pound Tries to Confuse Traders

Fundamental analysis
2024-12-30 04:05:07

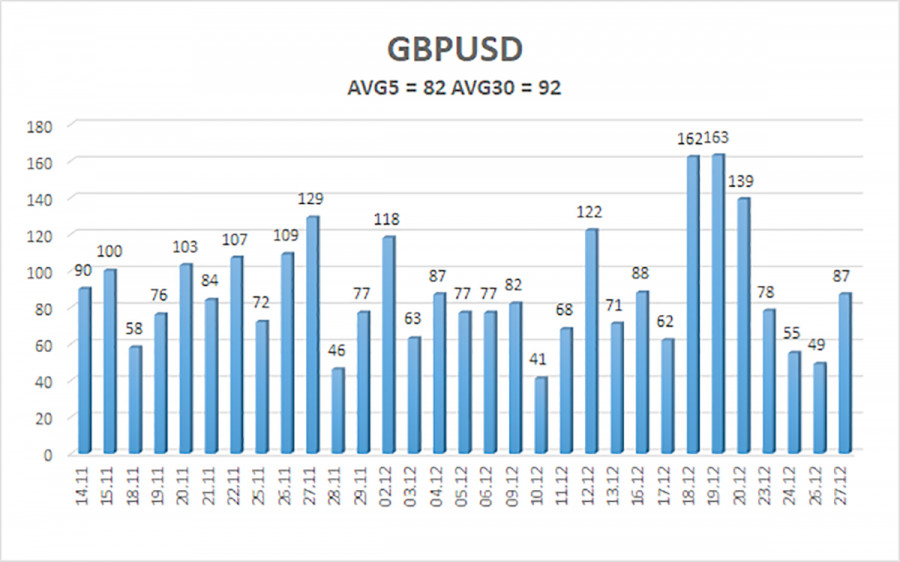
The GBP/USD currency pair demonstrated noticeable movement on Friday afternoon, with daily volatility reaching an "average" level. What led to this fluctuation at the end of the week? It is likely that there wasn't any specific trigger, as no news was released that day. However, we had previously cautioned that holiday weeks do not guarantee completely flat trading. After several days of stagnation, Friday evening saw a significant move of 70–80 pips, likely caused by a single large market participant in a thin market.
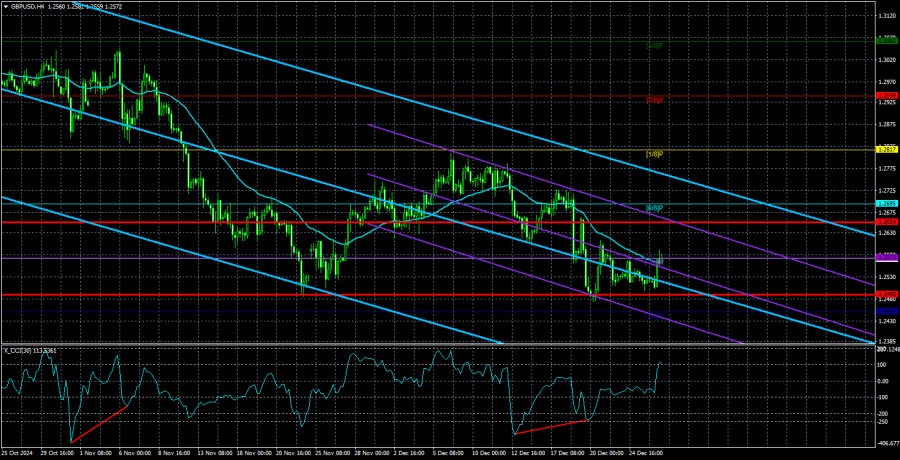
A similar "double bottom" pattern has emerged for the British pound, similar to what we have seen with the euro. However, as with the euro, we anticipate a continuation of the decline in line with the global trend on higher timeframes. The current 4-hour chart shows that the market is preparing for another downward move, which has simply been postponed to 2025. The second rebound from the 1.2490 level is considerably weaker than the first, indicating bearish pressure. While the bears have yet to break through this psychological barrier on their first or second attempts, it is likely they will succeed on a third or fourth attempt—unless unexpected events arise early next year.
This week, macroeconomic events in the UK will be sparse. Essentially, the holidays will continue, and only toward the end of the week can we expect increased volatility and market activity. The only notable release in the UK is Thursday's December manufacturing PMI in its second estimate—an entirely secondary indicator. Thus, traders will likely focus on the US ISM Manufacturing Index due on Friday.
Throughout the upcoming week, the pound may continue to trade sideways. It could even move slightly higher as part of a new corrective phase. However, it's important to note that a strong downward trend persists, interrupted only by the New Year holidays. Any correction is merely a temporary pause, allowing market makers to establish new positions that will likely align with the trend rather than oppose it.
The British pound still lacks significant drivers to challenge the US dollar. After the Federal Reserve announced plans to lower the key rate only twice next year, we became even more confident in the continued strength of the US dollar. Currently, we see no supporting factors for the pound. Perhaps the situation will shift slightly after January 20, when Donald Trump officially becomes the President of the United States, but as the saying goes, we'll have to wait and see. For now, the 1.2500 level appears to be just a temporary obstacle in the ongoing downward trend.

The average volatility of the GBP/USD pair over the last five trading days is 82 pips, considered "average" for this currency pair. On Monday, December 30, we expect the pair to move within the range defined by the 1.2490 and 1.2654 levels. The higher linear regression channel is directed downward, signaling a bearish trend. The CCI indicator recently dipped into the oversold area again, but the pound continues to aim for a resumption of the bearish trend, as we have repeatedly emphasized. Any oversold conditions within a downtrend serve merely as signals for correction. The bullish divergence on this indicator also points to a correction that might already be complete.
Nearest Support Levels:
- S1: 1.2451
Nearest Resistance Levels:
- R1: 1.2573
- R2: 1.2695
- R3: 1.2817
Trading Recommendations:
The GBP/USD pair continues to exhibit a bearish trend, although it is currently undergoing a correction. The 1.2500 level may be breached soon. We do not recommend long positions at this time, as we believe that the market has already accounted for all potential bullish factors for the pound multiple times, and no new drivers are emerging. For those who trade based purely on technical setups, long positions with a target of 1.2695 could be considered if the price consolidates above the moving average. However, short positions are much more relevant at this moment, with targets set at 1.2451 and 1.2413, provided that the price remains clearly below the moving average.
Explanation of Illustrations:
Linear Regression Channels help determine the current trend. If both channels are aligned, it indicates a strong trend.
Moving Average Line (settings: 20,0, smoothed) defines the short-term trend and guides the trading direction.
Murray Levels act as target levels for movements and corrections.
Volatility Levels (red lines) represent the likely price range for the pair over the next 24 hours based on current volatility readings.
CCI Indicator: If it enters the oversold region (below -250) or overbought region (above +250), it signals an impending trend reversal in the opposite direction.
Смотрите также


