EUR/USD and GBP/USD March 31 – Technical Analysis
Technical analysis
2025-03-31 07:07:20
EUR/USD
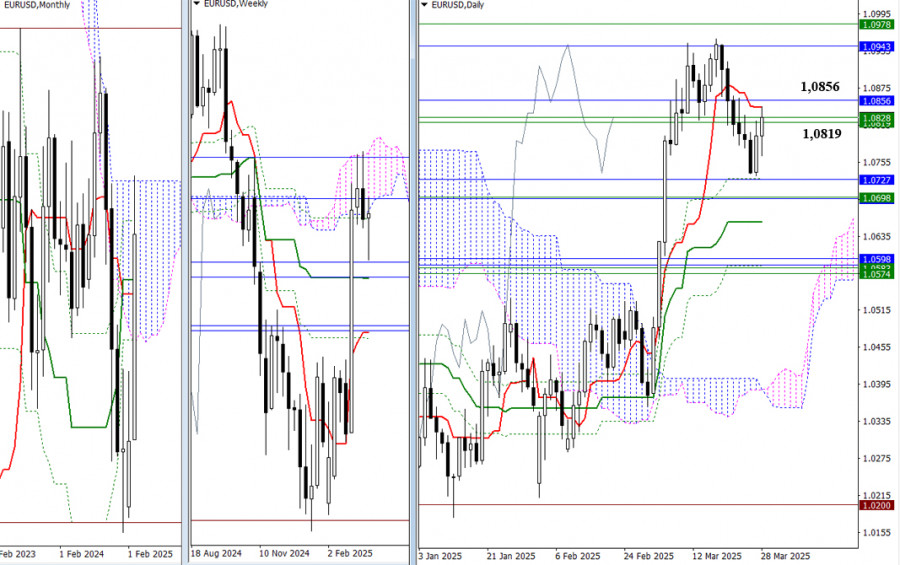
During the week, bearish players attempted to confirm the earlier-formed pullback and continue the decline but were unsuccessful, resulting in a long lower shadow on the weekly candlestick. The pair has returned to the cluster of resistance levels (1.0819–1.0856), which now represents the nearest resistance zone. Under the current conditions, a new phase of consolidation and uncertainty is possible. A firm consolidation above 1.0844–1.0856 would give buyers another opportunity to test the upper boundaries of the weekly (1.0978) and monthly (1.0943) Ichimoku clouds, aiming to break through and enter the bullish zone in terms of Ichimoku cloud analysis. If the current resistances are not broken and bearish players return to the market, the nearest downside targets in this part of the chart are around 1.0698–1.0727 and 1.0574–1.0598.
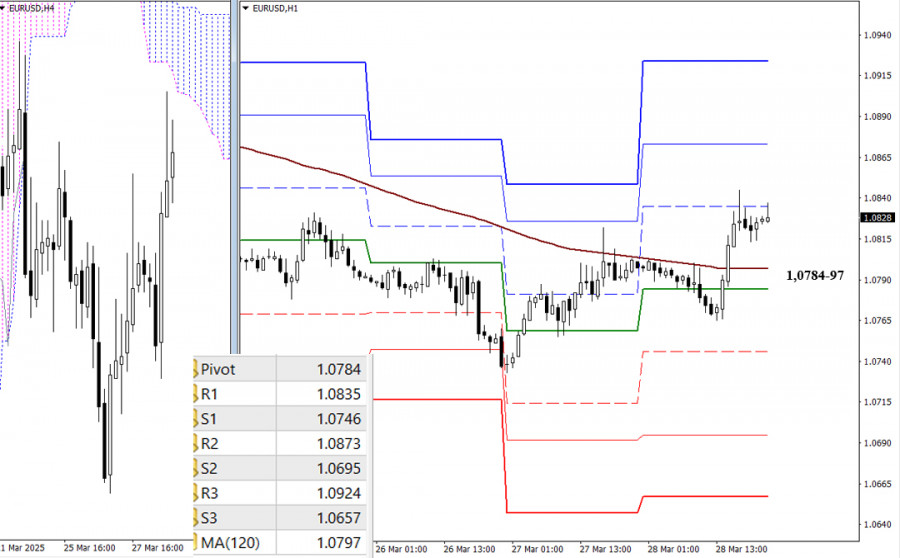
The main advantage currently lies with the bulls on the lower timeframes. If they reverse the weekly long-term trend (1.0797) and continue the upward movement, intraday reference points will be the resistances of the classic Pivot levels. Losing the key levels of 1.0784–1.0797 would affect the current balance of power, and increased bearish sentiment on the lower timeframes would develop through the breakdown of classic Pivot supports. Updated Pivot values will appear when the market opens.
***
GBP/USD
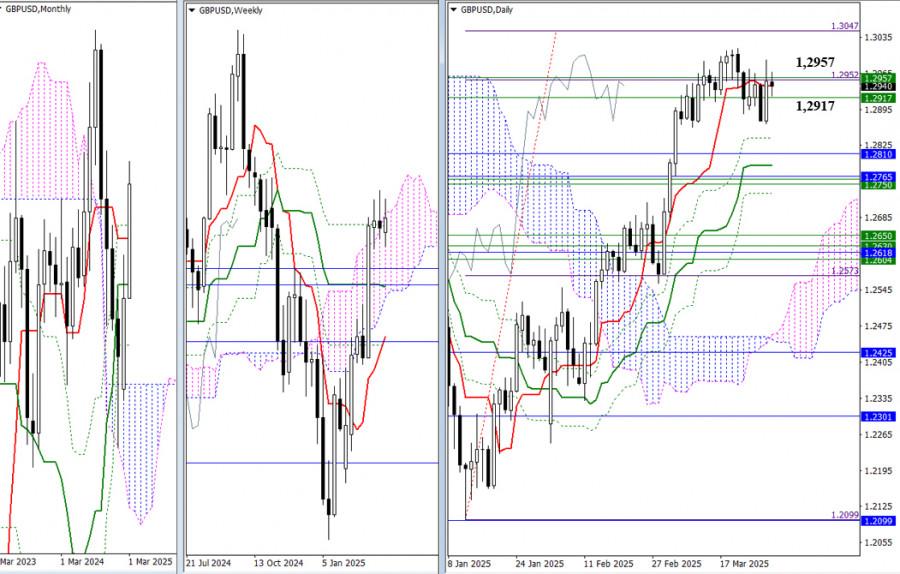
For the third consecutive week, the pound has been unable to exit the zone of uncertainty formed by the convergence of two weekly resistance levels (1.2917–1.2957) and the fulfillment of the daily target to break through the Ichimoku cloud at the first target level (1.2952). As a result, the situation has not significantly changed, and the following reference levels remain in place. For bulls, the nearest goal remains the daily target at 1.3047. Bears, meanwhile, still face a wide support zone that combines levels from multiple timeframes, headed by the monthly short-term trend (1.2765), the weekly medium-term trend (1.2761), and the daily medium-term trend (1.2786).
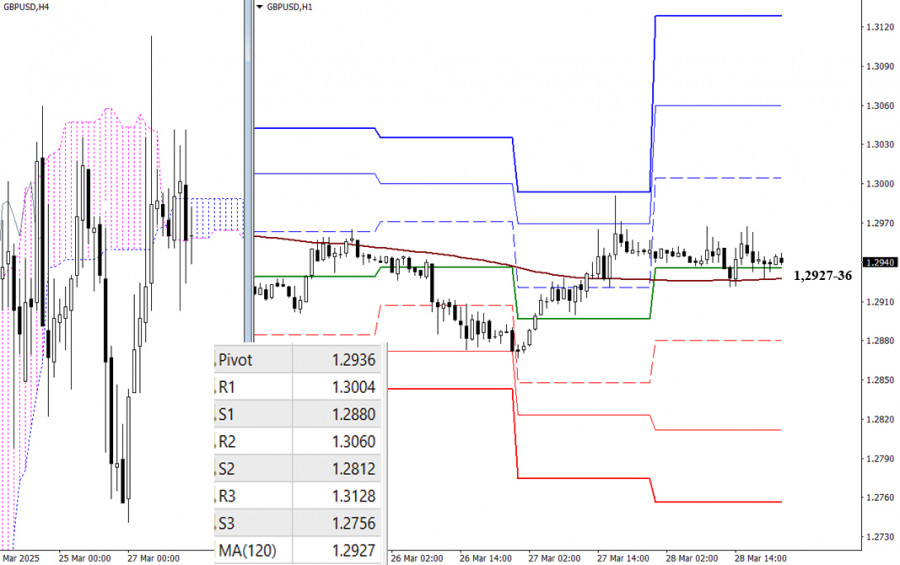
The uncertainty of the higher timeframes is also reflected in the lower timeframes. The pair has been hovering near the key levels of 1.2927–1.2936 (weekly long-term trend + daily central Pivot level) for an extended period. A restraining factor in this area is the influence of the H4 Ichimoku cloud, which is currently positioned almost horizontally. If a directional move forms, intraday reference points will be the support and resistance levels of the classic Pivot Points. New values for these Pivot levels will appear when the market opens.
***
Technical Analysis Components:
- Higher Timeframes: Ichimoku Kinko Hyo (9.26.52) and Fibonacci Kijun levels
- H1: Classic Pivot Points and 120-period Moving Average (weekly long-term trend)
Смотрите также