analytics1_1
Weekly Forecast Based on Simplified Wave Analysis for EUR/USD, USD/JPY, GBP/JPY, USD/CAD, NZD/USD, and GOLD as of June 30th
Weekly Forecast Based on Simplified Wave Analysis for EUR/USD, USD/JPY, GBP/JPY, USD/CAD, NZD/USD, and GOLD as of June 30th
Wave analysis
2025-06-30 08:57:27
EUR/USD
Analysis:
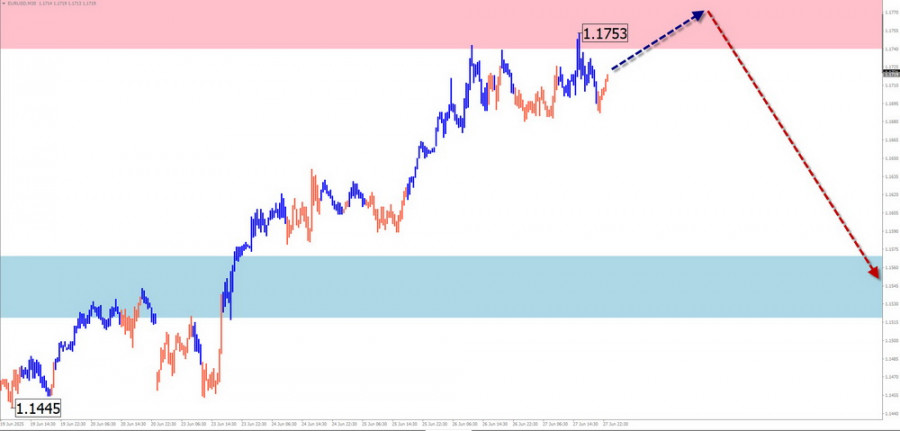
Since February of this year, the price movement of the euro has followed an upward wave algorithm. Since mid-April, a hidden correction has been forming within the structure. Trendlines drawn through the extremes form a "horizontal pennant" figure, which remains incomplete. The price has reached the lower boundary of a strong potential reversal zone.
Forecast:
In the coming days, a continuation of the sideways flat movement is expected. Near the resistance zone, a reversal setup is likely. A new downward vector is expected to begin by week's end.
Potential Reversal Zones
- Resistance: 1.1740 / 1.1790
- Support: 1.1570 / 1.1520
Recommendations:
- Buying: Possible in reduced volume during individual sessions, with a target no higher than the resistance zone.
- Selling: Recommended once your trading system confirms reversal signals.
USD/JPY
Analysis:
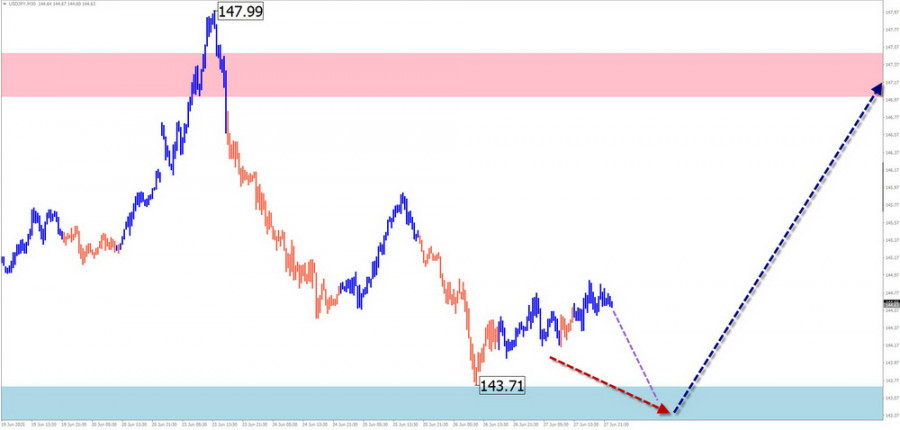
Since December last year, USD/JPY has followed a dominant downward wave, which remains incomplete. In the past month, the final part (wave C) has begun to form. The wave is developing in a sideways formation.
Forecast:
Sideways movement is expected to continue throughout the week. A brief decline early in the week cannot be ruled out, but it is likely to stay within support boundaries. In the second half of the week, the probability of a trend reversal and price increase toward the resistance zone increases.
Potential Reversal Zones
- Resistance: 147.00 / 147.50
- Support: 143.70 / 143.20
Recommendations:
- Selling: High risk, may result in losses.
- Buying: May be the primary strategy in the coming days; use smaller volume sizes for safety.
GBP/JPY
Analysis:
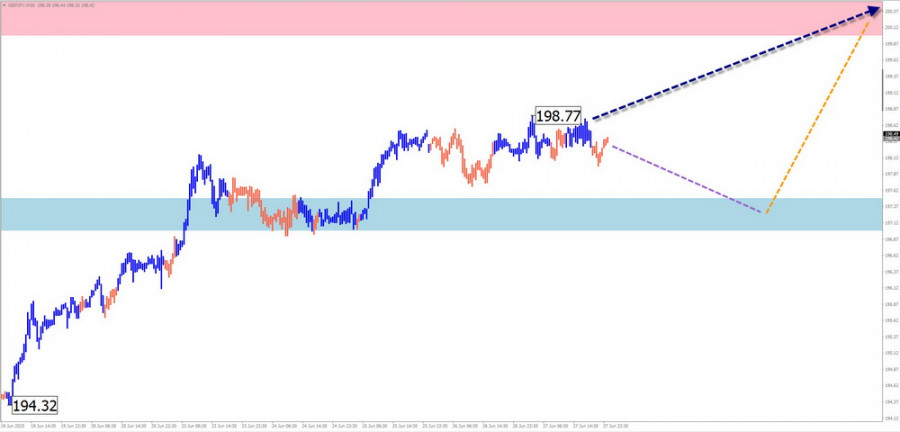
Since April, GBP/JPY has been moving within an upward wave. Prices are approaching the lower boundary of a major potential reversal zone on the weekly timeframe. The structure analysis indicates it is still incomplete.
Forecast:
The upward trend is expected to continue during the week, potentially reaching the resistance zone. Sideways movement or a brief decline within the support level is possible in the near term. Increased activity is anticipated toward the end of the week.
Potential Reversal Zones
- Resistance: 200.00 / 200.50
- Support: 197.50 / 197.00
Recommendations:
- Buying: May be used with fractional volume sizes during individual sessions; target limited to resistance.
- Selling: Premature until confirmed reversal signals appear near resistance.
USD/CAD
Analysis:
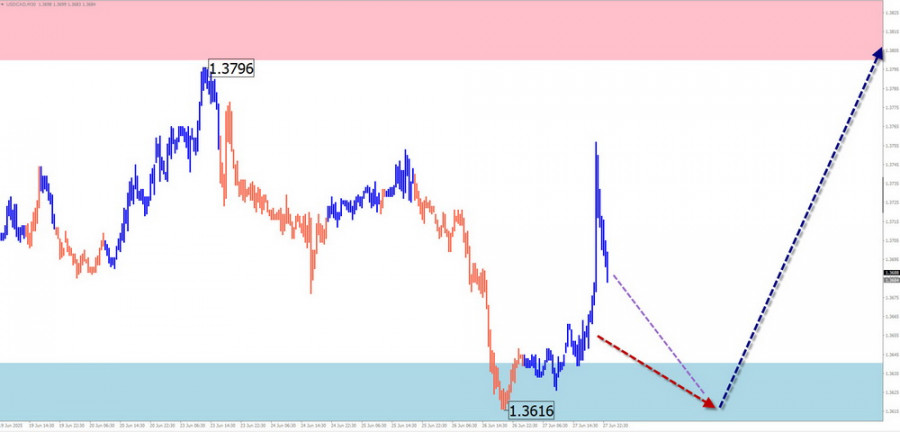
The downward wave that formed on the USD/CAD chart this year has been followed by a corrective move since late May. The pair is largely confined to a sideways price channel. The current wave structure remains incomplete, lacking its final segment.
Forecast:
The pair may decline further in the coming days, reaching the support zone. A reversal and upward movement from support may follow. The resistance zone reflects the upper boundary of the pair's expected weekly volatility.
Potential Reversal Zones
- Resistance: 1.3800 / 1.3850
- Support: 1.3640 / 1.3590
Recommendations:
- Selling: Possible intraday in small volumes, not beyond the support zone.
- Buying: Consider only after confirmed reversal signals appear near support.
NZD/USD
Brief Analysis:
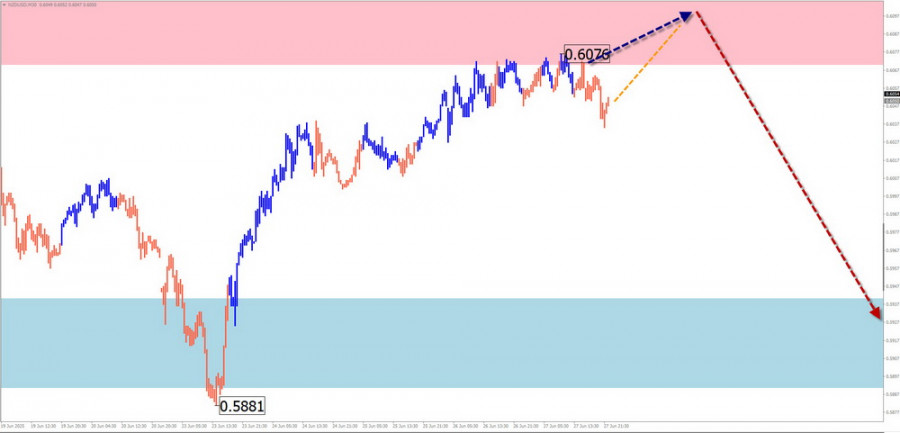
NZD/USD remains in a dominant bullish wave that began in April. Wave extremes form a "horizontal pennant" on the chart. The bearish phase since May 26 remains a part of internal correction. The bullish leg from June 23 has reversal potential.
Weekly Forecast:
The pair is likely to continue its upward movement for a few more days. A sideways trend and reversal conditions are expected near the resistance zone. Downward movement becomes more probable in the second half of the week.
Potential Reversal Zones
- Resistance: 0.6070 / 0.6120
- Support: 0.5940 / 0.5890
Recommendations:
- Selling: Low potential and potentially risky.
- Buying: Can be considered if reversal signals appear near the support zone.
GOLD
Analysis:
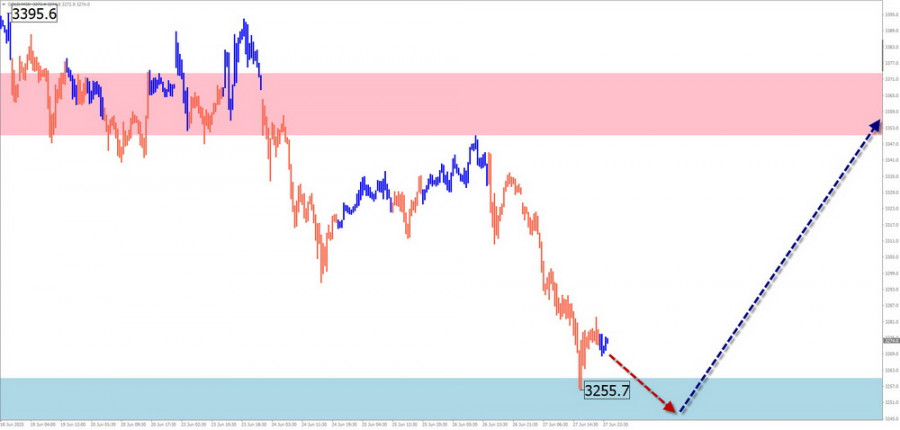
Since April, gold has mostly moved sideways. The current descending phase serves as a correction to the previous bullish trend and forms a "horizontal pennant." The price is testing the upper boundary of the two-month range.
Forecast:
Pressure on the support zone may ease in the coming days. A reversal and renewed price rise could follow. Most of the price activity is expected closer to the weekend.
Potential Reversal Zones
- Resistance: 3350.0 / 3370.0
- Support: 3260.0 / 3240.0
Recommendations:
- Selling: Low potential, could be unprofitable.
- Buying: Can be considered as the primary strategy after reversal signals appear near support according to your trading system.
Notes:In simplified wave analysis (SWA), all waves consist of three segments (A-B-C). Each timeframe analyzes the last, incomplete wave. Dotted lines show expected movement paths.
Important:The wave algorithm does not account for the time duration of price movements!
Смотрите также