analytics1_1
Trading Recommendations and Analysis for GBP/USD on July 1: The Pound Didn't Stay in Correction for Long
Trading Recommendations and Analysis for GBP/USD on July 1: The Pound Didn't Stay in Correction for Long
Trading plan
2025-07-01 01:37:09
GBP/USD 5-Minute Analysis
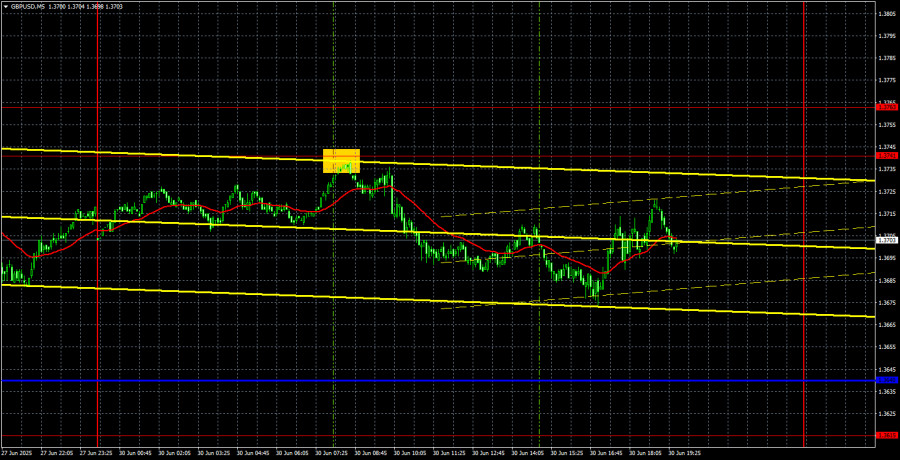
On Monday, the GBP/USD currency pair corrected slightly following last week's strong rally. In just four days, the British pound rose by 400 pips (from the movement's low to its high), and over the next two days corrected by only 85. Technically, the price failed to even break through the critical line. It rebounded from the Kijun-sen line, which was located nearby, so there is every chance for the trend to resume.
The only notable event on Monday was the release of the final Q1 GDP reading in the UK. The third estimate fully matched the second — the British economy grew by 0.7%. But does anyone seriously believe that this report prevented the dollar from strengthening at least a bit? The U.S. dollar remains under intense pressure from Donald Trump's policies. And to make the dollar fall, there's no need for daily news triggers anymore.
This week in the U.S., several important reports are scheduled, but even now, they don't bode well for the dollar. The U.S. labor market has shown strong results in recent months, but as soon as it begins to weaken (which is quite possible), the dollar will lose that last pillar of support.
Within the 5-minute timeframe, the price formed a solid sell signal at the opening of the European session. The pair bounced from the 1.3741 level and then moved down 50 pips, reaching the Kijun-sen line — though this isn't visible on the corresponding chart since the Kijun-sen line shifted throughout the day. Thus, the target was achieved, and the bounce from the critical line also allowed for opening long positions, which were profitable as well.
COT Report
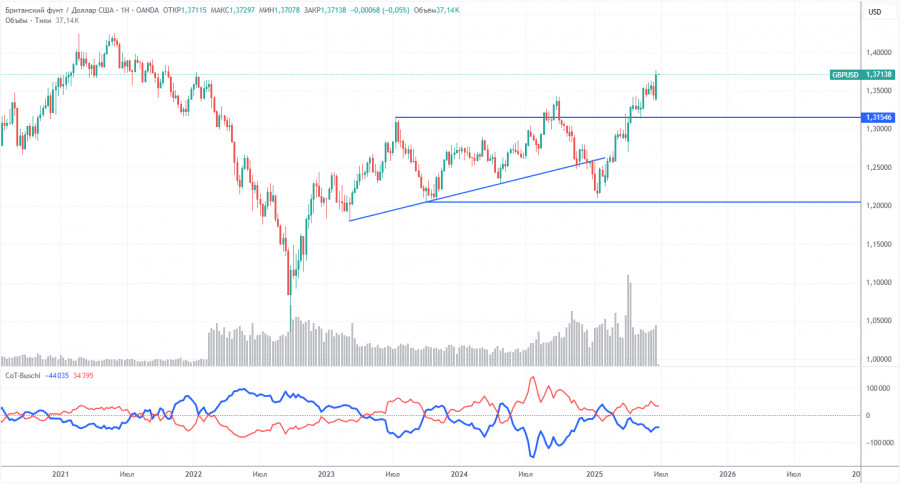
COT reports for the British pound indicate that commercial traders' sentiment has shifted constantly over the past few years. The red and blue lines, representing the net positions of commercial and non-commercial traders, frequently cross and typically remain near the zero line. Currently, they are also close to each other, indicating a roughly equal number of buy and sell positions. However, over the past year and a half, the net position has been increasing.
The dollar continues to weaken due to Trump's policies, making sterling demand among market makers less relevant at the moment. The trade war will continue in some form, and the Fed's key interest rate may drop significantly in the coming years — more than the economic outlook justifies. Thus, demand for the dollar will fall regardless. According to the latest COT report on the pound, the "Non-commercial" group closed 6,400 buy contracts and 2,000 sell contracts. This means the net position shrank by 8,400 contracts, but this carries virtually no significance.
In 2025, the pound has seen a sharp increase, but there's one main reason — Trump's policies. Once this factor fades, the dollar could start recovering. But when that happens, it is anyone's guess. Trump is only at the beginning of his presidency, and the next four years may bring many more shocks.
GBP/USD 1-Hour Analysis

On the hourly timeframe, GBP/USD continues its new upward push. The market paused for a couple of days, regrouped, and now seems ready to resume its strong uptrend. As we can see, news isn't always necessary for the dollar to fall. Currently, virtually any news from the U.S. is viewed as a reason to sell the dollar.
For July 1, we identify the following key trading levels: 1.3212, 1.3288, 1.3358, 1.3439, 1.3489, 1.3537, 1.3615, 1.3741–1.3763, 1.3833, 1.3886. The Senkou Span B line (1.3508) and Kijun-sen line (1.3679) may also serve as signal sources. The Stop Loss level should be set to breakeven once the price moves 20 pips in the correct direction. Ichimoku indicator lines may shift throughout the day, so this should be taken into account when identifying signals.
On Tuesday, the UK will publish the manufacturing PMI, but we don't expect any market reaction to this indicator. It will be the second estimate for June, which is unlikely to differ significantly from the first, as the market has already factored it in. In the U.S., the key ISM Manufacturing Index is scheduled for release, and Federal Reserve Chair Jerome Powell will deliver another speech. These events are far more critical, though they're unlikely to reverse the current trend.
Illustration Explanations:
- Support and resistance price levels – thick red lines where movement may end. They are not trading signal sources.
- Kijun-sen and Senkou Span B lines—These are strong Ichimoku indicator lines transferred to the hourly timeframe from the 4-hour one.
- Extremum levels – thin red lines where the price has previously rebounded. These act as trading signal sources.
- Yellow lines – trend lines, trend channels, and other technical patterns.
- COT Indicator 1 on the charts – the size of the net position for each category of traders.
Смотрите также