EUR/USD Forecast for July 2, 2025
Technical analysis
2025-07-02 03:12:52
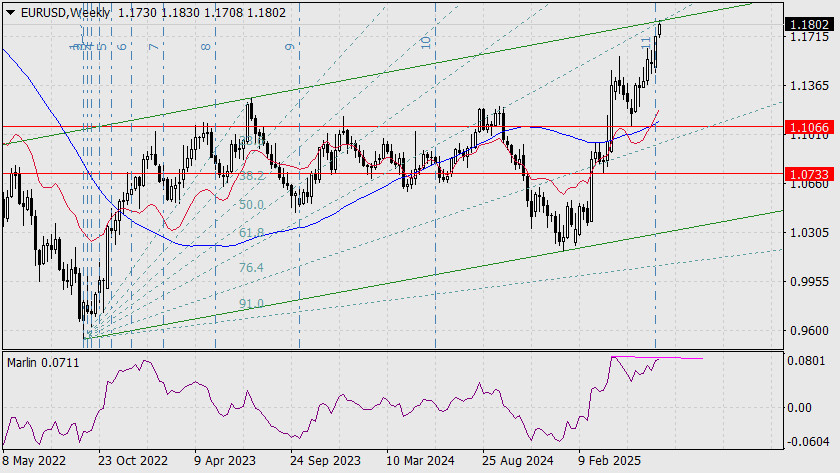
So, the euro quote has reached point X. Yesterday evening on the weekly chart, the price touched the upper boundary of the price channel, a Fibonacci ray, and all of this occurred at the end of the 11th Fibonacci time boundary.
Naturally, the divergence with the Marlin oscillator is signaling a potential price reversal.
On the daily chart, the Marlin oscillator has started to turn downward. However, a confirmed reversal will likely only come after the price settles below the MACD line at 1.1646.
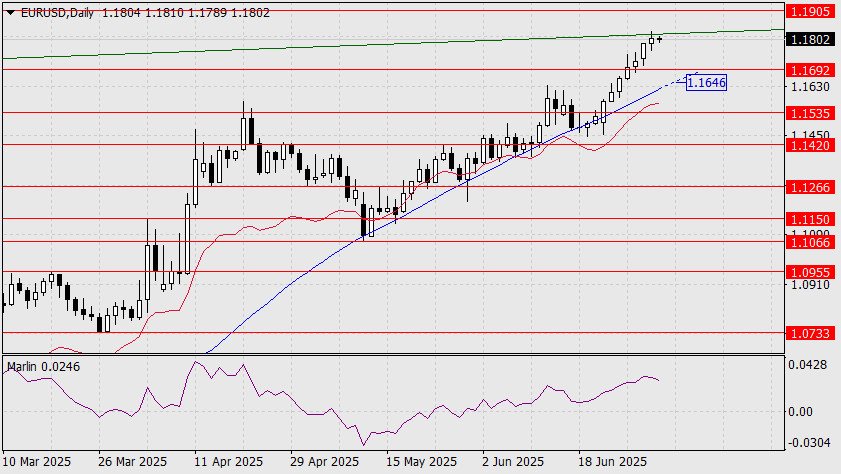
Still, one should not overlook tomorrow's U.S. employment data, which could become a trigger for either a reversal or a disruption of these signals.
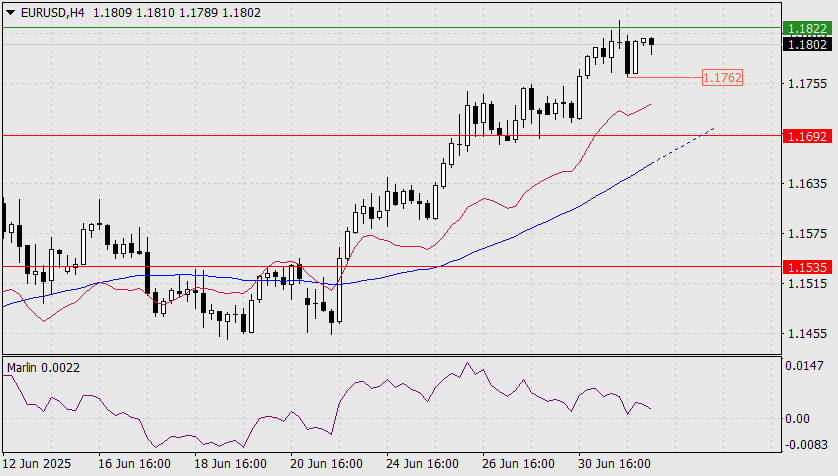
On the four-hour chart, the Marlin oscillator is steadily declining despite rising prices. Once it moves into negative territory—which will happen if the price falls below yesterday's low of 1.1762—the bearish outlook will gain stronger justification.
Смотрите также