analytics1_1
Trading Recommendations and Trade Analysis for EUR/USD on November 25. Euro Continues to Convulse
Trading Recommendations and Trade Analysis for EUR/USD on November 25. Euro Continues to Convulse
Trading plan
2025-11-25 02:24:36
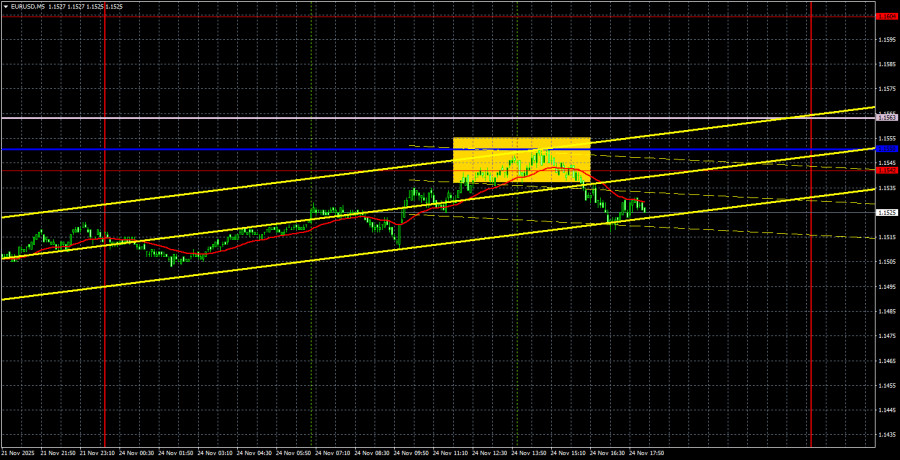
Analysis of EUR/USD 5M
The EUR/USD currency pair attempted to begin an upward trend on the hourly timeframe for the third time in recent days on Monday, but it was unsuccessful once again. For several consecutive days, the euro has essentially been trading within another flat range below a critical line. There were no significant macroeconomic data or fundamental events on Monday in either the EU or the U.S., so yet another flat, yet another "boring Monday," and another low volatility were entirely predictable. The market not only does not want to trade right now, but there were also no drivers present on Monday.
From a technical perspective, the price has broken the descending trend line, but what is the point of this if it cannot break the lines of the Ichimoku indicator? We saw another breach of another descending trend line, once again without any "consequences." If the pair fails to consolidate above the Ichimoku indicator lines, the downward movement will continue within the daily flat channel of 1.1400-1.1830, despite the trend line break.
On the 5-minute timeframe, only one trading signal was generated yesterday, but it could be executed. However, it's quite challenging to expect profit in the market right now—there are virtually no movements. The price bounced off the 1.1542-1.1563 area, allowing short positions to be opened. By the end of the day, these could be closed for a profit of around 10 pips, or left open with a Stop Loss placed at breakeven.
COT Report
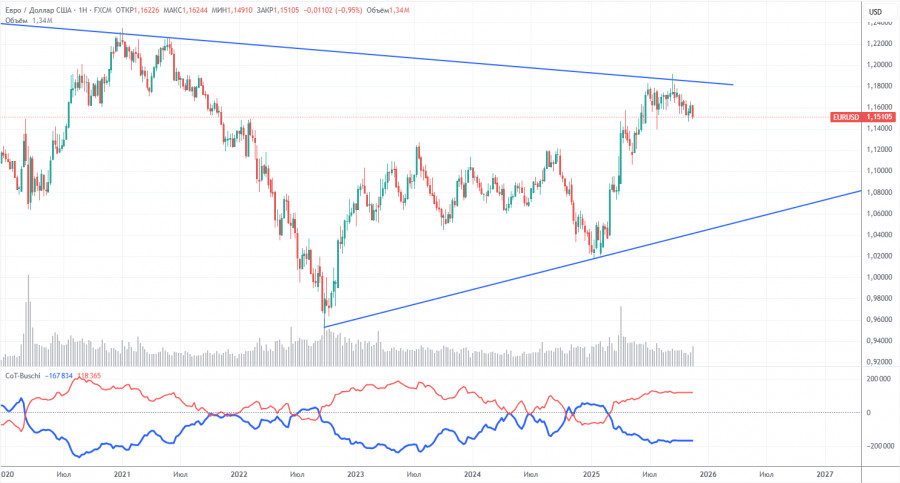
The last COT report was published last week and is dated October 7, making it, to put it mildly, outdated. The illustration above clearly shows that the net position of non-commercial traders has long been "bullish." Bears barely entered the zone of their own superiority at the end of 2024 but quickly lost it again. Since Trump took office for a second time, the dollar has been falling. We cannot say with 100% certainty that the decline of the U.S. currency will continue, but current global developments hint at just such a scenario.
We still do not see any fundamental factors supporting the strengthening of the euro, but we do see enough factors supporting the decline of the dollar. The global downward trend still persists, but what significance does it have for the price movement over the last 17 years? The dollar could rise if the global fundamental picture changes, but currently, there are no signs of that.
The positions of the red and blue lines in the indicator continue to show a bullish trend. Over the last reporting week, the number of longs in the "Non-commercial" group increased by 3,300, while the number of shorts increased by 2,400. Consequently, the net position increased by 900 contracts over the week. However, this data is already outdated and irrelevant.
Analysis of EUR/USD 1H
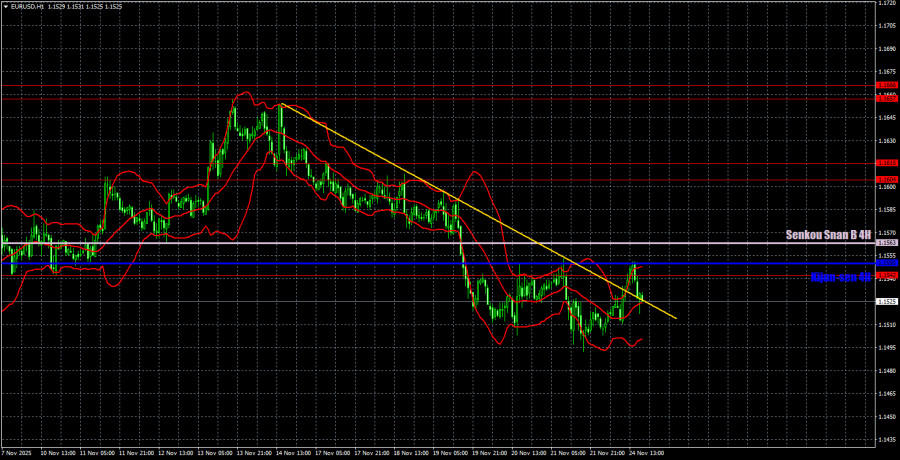
On the hourly timeframe, the EUR/USD pair continues to form a downward trend despite breaking the trend line. The price remains within the daily flat channel of 1.1400-1.1830, and a near-term rise in the euro to 1.1800 can be expected, even within the context of the local trend. However, such movement now requires price consolidation above the Senkou Span B and Kijun-sen lines.
For November 25, we highlight the following trading levels: 1.1234, 1.1274, 1.1362, 1.1426, 1.1542, 1.1604-1.1615, 1.1657-1.1666, 1.1750-1.1760, 1.1846-1.1857, 1.1922, 1.1971-1.1988, as well as the Senkou Span B line (1.1563) and the Kijun-sen line (1.1550). The Ichimoku indicator lines may move during the day, which should be taken into account when determining trading signals. Do not forget about setting a Stop Loss to breakeven if the price moves in the correct direction by 15 pips. This will protect against potential losses if the signal turns out to be false.
On Tuesday, no significant events are scheduled in the Eurozone, while several reports will be released in the United States. However, we do not believe that these will change the current situation. The Producer Price Index, the ADP report, and retail sales are certainly interesting, but they are not the most crucial indicators of the state of the American economy.
Trading Recommendations:
On Tuesday, traders may trade from the 1.1542 level, combined with the critical line. In case of a bounce, consider selling, while consolidation above the Senkou Span B line will justify buying. However, last week and Monday have once again demonstrated what we constantly state—the market is reluctant to trade, volatility remains low, and logical movements are still rare.
Explanations for the Illustrations:
- Support and resistance price levels are indicated by thick red lines, where price movement may halt. They are not sources of trading signals.
- The Kijun-sen and Senkou Span B lines are lines of the Ichimoku indicator that are transferred from the 4-hour timeframe to the hourly timeframe. They are strong lines.
- Extremum levels are thin red lines from which the price has previously bounced. They are sources of trading signals.
- Yellow lines are trend lines, trend channels, and any other technical patterns.
- Indicator 1 on the COT charts represents the size of the net position of each category of traders.
Смотрите также