analytics1_1
How to Trade the GBP/USD Currency Pair on May 14? Simple Tips and Trade Analysis for Beginners
How to Trade the GBP/USD Currency Pair on May 14? Simple Tips and Trade Analysis for Beginners
Trading plan
2026-05-14 04:05:11
Analysis of Wednesday's Trades:
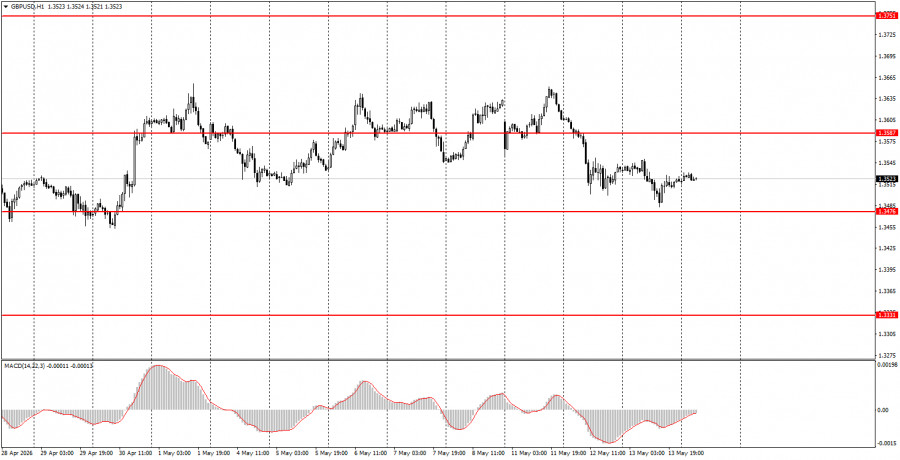
1-Hour Chart of the GBP/USD Pair:
The GBP/USD pair attempted to continue its downward movement on Wednesday, but the plan failed. The market exhausted the grounds for selling the British pound and buying the US dollar. Zooming in on the hourly timeframe shows that the movements over the last three days have not affected the overall technical picture. Since April 14 (exactly one month), the GBP/USD pair has been trading in a flat range between 1.3450 and 1.3640. Yes, the sideways channel is wide enough for the hourly chart, but that is the reality. For a whole month, traders have not found new reasons for either an upward trend or a downward one. There is no real de-escalation or progress in negotiations between Iran and the US for the former. For the latter, there is no genuine escalation (just threats) and a complete failure in negotiations. Macroeconomic factors and expectations regarding central bank monetary policy are currently of no interest to the market. Another US inflation report was ignored yesterday, another the day before, and important labor-market data on unemployment were ignored last Friday.
5-Minute Chart of the GBP/USD Pair:
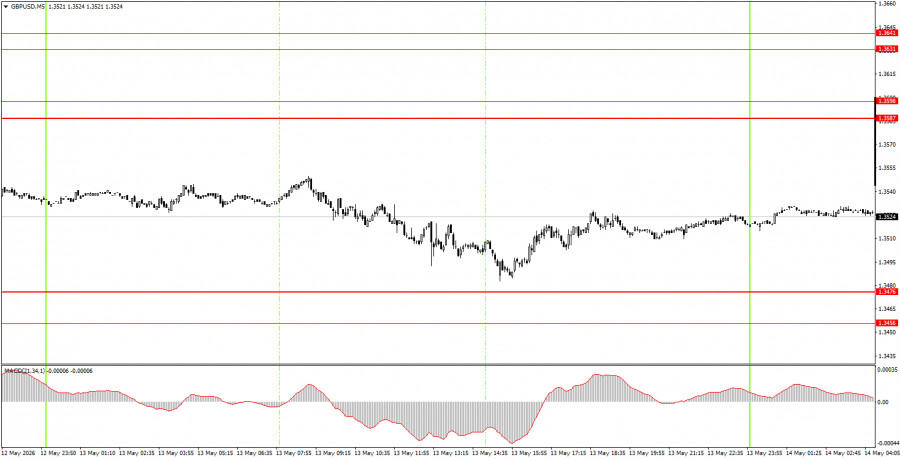
On the 5-minute timeframe, there were no trading signals formed on Wednesday. The last signal was created on Tuesday when the price breached the 1.3587-1.3598 area. Novice traders could easily carry the short position over to Wednesday. The target area of 1.3456-1.3476 has been practically fulfilled.
How to Trade on Thursday:
On the hourly timeframe, the GBP/USD pair remains in an upward trend but has been trading sideways for a month. Without a significant escalation in the Middle East, the dollar cannot be expected to rise as it did in February-March. Individual events may still provoke their strengthening, but overall, the geopolitical factor has weakened its influence on the market. The British currency retains excellent upward prospects according to the trends on the daily and weekly timeframes.
On Thursday, novice traders may open short positions targeting the 1.3456-1.3476 area if the pair bounces from the 1.3587-1.3598 area. A bounce from the 1.3456-1.3476 area will allow for opening long positions targeting 1.3587-1.3598.
On the 5-minute timeframe, the following levels can be traded: 1.3175-1.3180, 1.3259-1.3267, 1.3319-1.3331, 1.3380-1.3386, 1.3456-1.3476, 1.3587-1.3598, 1.3695, and 1.3741-1.3751. Today, reports on first-quarter GDP and industrial production will be released in the UK, which will likely also be ignored. In the US, retail sales data will be released.
Main Rules of the Trading System:
- The strength of the signal is determined by the time it took to form the signal (bounce or breakout of the level). The less time it took, the stronger the signal.
- If two or more trades were opened near any level based on false signals, all subsequent signals from this level should be ignored.
- In a flat market, any pair can generate many false signals or none at all. Technical levels may be ignored.
- On the hourly timeframe, it is preferable to trade signals from the MACD indicator only in the presence of good volatility and a trend that is confirmed by a trend line or trend channel.
- If two levels are too close together (5-20 pips apart), treat them as a support or resistance zone.
- After a move of 15 pips in the right direction, a Stop Loss should be set to breakeven.
What is on the Charts:
Price levels (areas) of support and resistance – levels that are targets when opening purchases or sales, or sources of signals.
Red lines – channels or trend lines that display the current trend and indicate which direction is preferable to trade now.
MACD indicator (14, 22, 3) – histogram and signal line – a supporting indicator that can also be used as a source of signals.
Important speeches and reports (contained in the news calendar) can significantly influence the movement of the currency pair. Therefore, during their release, trading should be done as cautiously as possible, or one should exit the market to avoid a sharp price reversal against the preceding movement.
Beginners trading in the Forex market should remember that not every trade can be profitable. Developing a clear strategy and sound money management are key to long-term trading success.
Смотрите также