analytics1_1
How to Trade the GBP/USD Currency Pair on June 12? Simple Tips and Trade Analysis for Beginners
How to Trade the GBP/USD Currency Pair on June 12? Simple Tips and Trade Analysis for Beginners
Trading plan
2026-06-12 03:29:55
Analysis of Thursday's Trades:
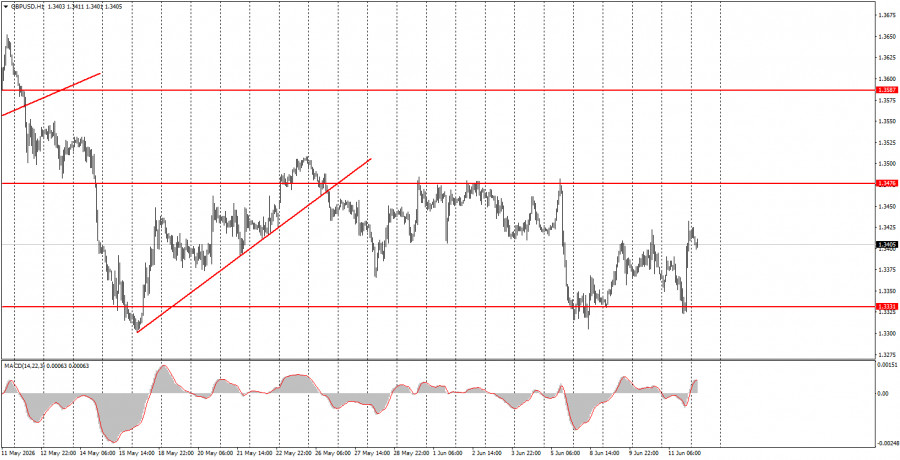
1H Chart of GBP/USD
The GBP/USD pair also exhibited notable trading movement on Thursday. Firstly, the British pound has remained within the sideways channel of 1.3331-1.3476 for almost a month now. Secondly, Donald Trump once again changed his rhetoric regarding Iran twice in one day (and this is not even the maximum possible). In the morning, the US president accused Iran of derailing negotiations and announced new powerful strikes, while in the evening, he announced that a superb deal with Iran was imminent and canceled the new attacks. It is worth mentioning that in Iran, they continue to wonder what Trump is talking about, as they have not heard of any agreement. Nevertheless, the market has taken Trump's latest promises as a reason to start selling the dollar again. After all, how else can the market react if the war is about to end and the Strait of Hormuz will be opened? The market continues to trip over the same rake. Today, Trump will likely announce that he has changed his mind, Iran is once again dragging out negotiations, displaying aggression, and therefore orders for new strikes will be given. And the dollar will rise again.
5M Chart of GBP/USD
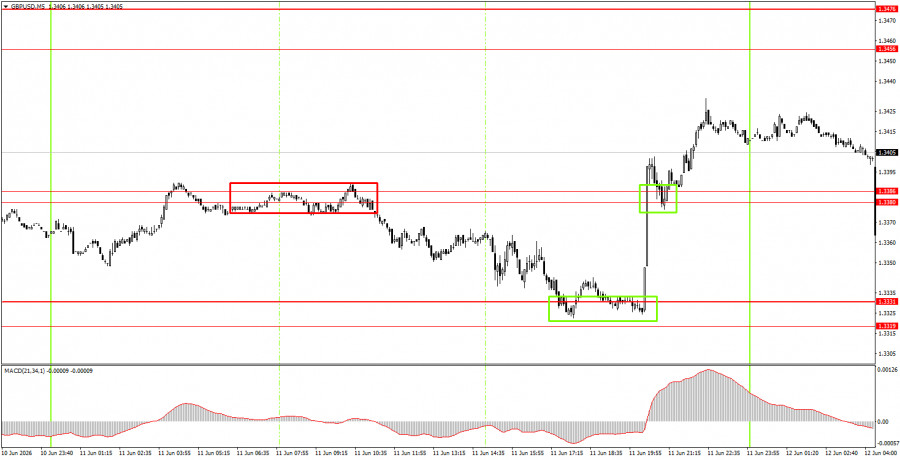
On the 5-minute timeframe on Thursday, three very good trading signals were formed. During the European trading session, the pair bounced from the area of 1.3380-1.3386. In the American session, it bounced from the area of 1.3319-1.3331, then, ten minutes later, it broke through the area of 1.3380-1.3386. Thus, novice traders could open two trades (one short and one long), each of which would have made a profit.
How to Trade on Friday:
On the hourly timeframe, the GBP/USD pair has been trading flat for a month, as the geopolitical situation remains consistently bad, neither improving nor worsening. Without a resumption of full-scale war in the Middle East, the dollar cannot expect the growth it saw in February-March. Individual events may still prompt further strengthening, but we do not believe the market will trigger a new wave of risk-off flows into the dollar. Under Trump, the dollar itself is a risky asset.
On Friday, novice traders can open new short positions targeting 1.3319-1.3331 if the price consolidates below the 1.3380-1.3386 area. A bounce in the 1.3380-1.3386 area will allow opening long positions targeting 1.3456-1.3476.
On the 5-minute timeframe, trading can currently be conducted at the following levels: 1.3175-1.3180, 1.3259-1.3267, 1.3319-1.3331, 1.3380-1.3386, 1.3456-1.3476, 1.3587-1.3598, 1.3631-1.3641, 1.3695, 1.3741-1.3751. On Friday, reports on GDP and industrial production are scheduled for release in the UK, but it is well understood that these data hold little meaning right now. In the US, the University of Michigan's consumer sentiment index will be published.
Basic Rules of the Trading System:
- The strength of a signal is determined by the time required to form it (a bounce or a breakout). The less time taken, the stronger the signal.
- If two or more trades were opened at a particular level based on false signals, subsequent signals from that level should be ignored.
- In a flat market, any pair may form many false signals or none at all. Technical levels may be disregarded.
- On the hourly timeframe, trading signals from the MACD indicator should be executed only when volatility is good, and a trend is confirmed by a trend line or channel.
- If two levels are too close together (5 to 20 pips), they should be considered a support or resistance area.
- After moving 15 pips in the correct direction, a Stop Loss should be set at breakeven.
What's on the Charts:
Price levels (areas) of support and resistance are targets when opening long or short positions or sources of signals.
Red lines indicate channels or trend lines that display the current trend and indicate the preferred direction for trading.
The MACD indicator (14,22,3) – histogram and signal line – is a supplementary indicator that can also be used as a source of signals.
Important speeches and reports (contained in the news calendar) can significantly impact the movement of the currency pair. Therefore, during their release, trading should be conducted with maximum caution, or one should exit the market to avoid sharp reversals against preceding movements.
Beginners trading in the forex market should remember that not every trade can be profitable. Developing a clear strategy and practicing money management are key to long-term success in trading.
Смотрите также