EUR/USD Review. June 18: ECB and Iran Deal Fail to Support Euro
Fundamental analysis
2026-06-18 02:34:33
The EUR/USD currency pair continued to trade with subdued volatility on Wednesday, moving slowly and with no expectation of anything extraordinary. As we regularly mention in our reviews, periods of flat or low volatility are completely normal and familiar for any market and any instrument. There is no need to explain this using various fantastic theories; it is just a matter of fact. After periods of activity and trending, calm and corrective phases follow. The chart below clearly shows that the EUR/USD pair has only exhibited volatility above 75 pips twice in the last 30 trading days. Therefore, it can be confidently said that the market is not prepared for active actions at this time, and its sentiment is unlikely to be influenced by central bank meetings or the signing of a deal between Iran and the U.S.
Last night, the FOMC held its meeting, the first under Kevin Warsh's leadership. Traditionally, we won't analyze the results or the market reaction to this event, as we believe that at least one day should pass after the central bank's meeting for market emotions to subside or, conversely, fully manifest. Only then can we draw conclusions. Thus, in this article, we will draw traders' attention to the fact that neither the forthcoming deal between Iran and the U.S., nor the tightening of the European Central Bank's monetary policy, nor the significant likelihood of continued rate hikes by the ECB and "hawkish" statements from European central banks can shift the pair from its deadlock. Why?
Answering this question is rather complicated, but it can be done. Markets have been anticipating the deal between Iran and the U.S. for quite a while. Based on Trump's statements and promises, it should have been signed two months ago. Thus, to some extent, this factor has long been priced in. So why isn't the dollar falling? The signing of the deal does not guarantee the absence of new escalations within a week. Because the market has no confidence that Tehran and Washington will reach an agreement regarding Iran's nuclear stockpiles and missiles. Because the market realizes that Trump is being compliant right now due to the upcoming Congressional elections in the U.S., and the current president needs to quickly conclude the war, declare victory, and navigate the elections with minimal losses in both houses of Congress, after which he can once again engage in conflicts worldwide. In other words, there is no market trust in either Trump or the Iran deal.
Regarding the ECB's monetary policy tightening, market focus remains solely on the dollar. As long as traders doubt a long-term peace in the Middle East, the dollar may maintain its dominant position in the currency market. At the same time, let's remember that the daily and weekly time frames still show upward trends. Corrections and flat periods have already dragged on for a considerable time, but no one knows what the next actions of the American president will be to restructure the entire world, which might trigger a new dollar collapse.
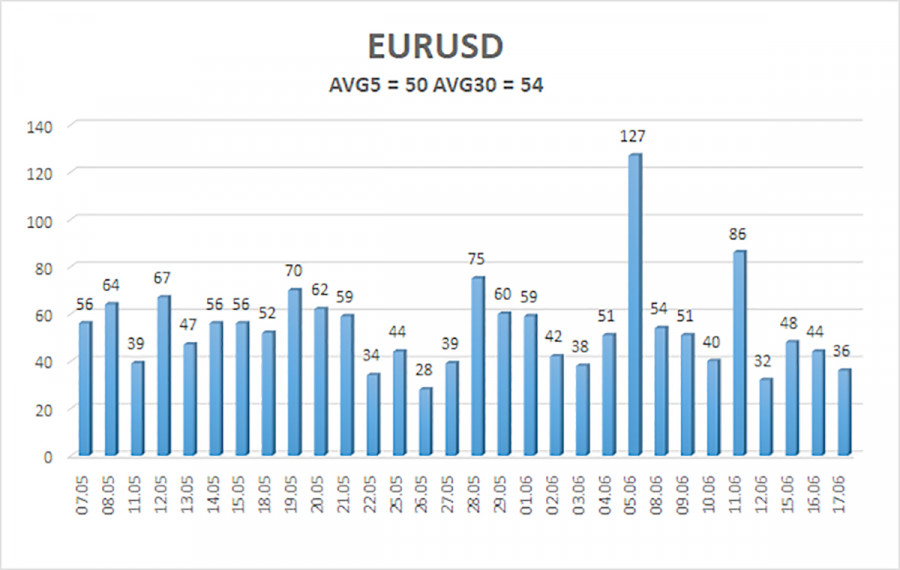
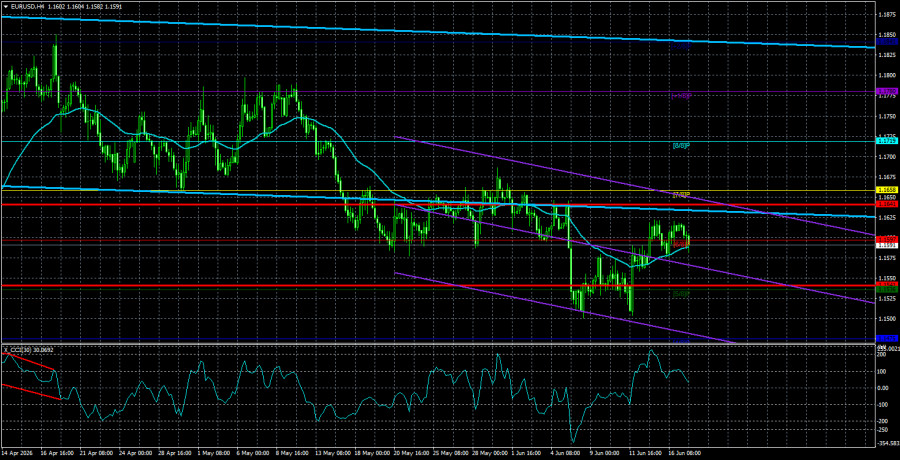
The average volatility of the EUR/USD currency pair over the last five trading days, as of June 18, stands at 50 pips and is characterized as "medium-low." We expect the pair to move between 1.1541 and 1.1641 on Thursday. The upper linear regression channel has turned upward, indicating a potential change in trend to bullish. The CCI indicator has entered oversold territory, signaling a possible end to the correction.
Nearest Support Levels:
- S1 – 1.1536
- S2 – 1.1475
- S3 – 1.1414
Nearest Resistance Levels:
- R1 – 1.1597
- R2 – 1.1658
- R3 – 1.1719
Trading Recommendations:
The EUR/USD pair continues its downward movement, which is presumably a correction within the framework of a global uptrend. The global fundamental backdrop for the dollar remains extremely negative, with only geopolitical factors regularly supporting it. With the price positioned below the moving average, short positions can be considered, targeting 1.1536 and 1.1475. Above the moving average, long positions become relevant with targets at 1.1719 and 1.1780. Hopes for peace between Iran and the U.S. have increased, so the dollar is losing its main support factor.
Explanations for Illustrations:
- Linear regression channels help determine the current trend. If both are directed the same way, it indicates a strong trend at present.
- The moving average line (settings: 20,0, smoothed) determines the short-term trend and the direction in which trading should currently take place.
- Murray levels are target levels for movements and corrections.
- Volatility levels (red lines) represent the likely price channel in which the pair will spend the next day, based on current volatility metrics.
- The CCI indicator entering the oversold area (below -250) or the overbought area (above +250) indicates that a trend reversal in the opposite direction is approaching.
Смотрите также