analytics1_1
Weekly Forecast Based on Simplified Wave Analysis for EUR/USD, USD/JPY, GBP/JPY, USD/CAD, NZD/USD, and Gold – July 27th
Weekly Forecast Based on Simplified Wave Analysis for EUR/USD, USD/JPY, GBP/JPY, USD/CAD, NZD/USD, and Gold – July 27th
Wave analysis
2026-07-27 07:38:04
EUR/USD
Analysis
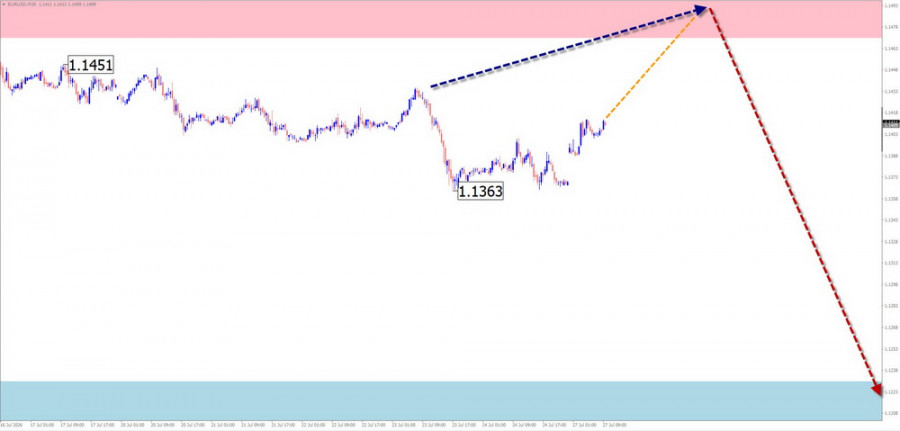
The primary euro currency pair has remained in a downward trend since the beginning of this year. The current unfinished segment is corrective in nature and remains within the boundaries of the final wave (C). This wave has been developing since the end of June. The price is currently trading near the lower boundary of a potential reversal zone on the hourly chart.
Forecast
Over the coming week, the euro is expected to continue trading sideways, with a potential move towards the resistance zone. A test of the upper boundary of the zone, including a brief breakout above it, cannot be ruled out. By the end of the trading week, the pair is likely to reverse and resume its downward movement.
Potential Reversal Zones
Resistance:
- 1.1470–1.1520
Support:
- 1.1230–1.1180
Trading Recommendations
Buy: Intraday buying opportunities may be considered using a reduced position size.
Sell: Selling opportunities will become relevant after confirmed reversal signals appear in the resistance zone.
USD/JPY
Analysis
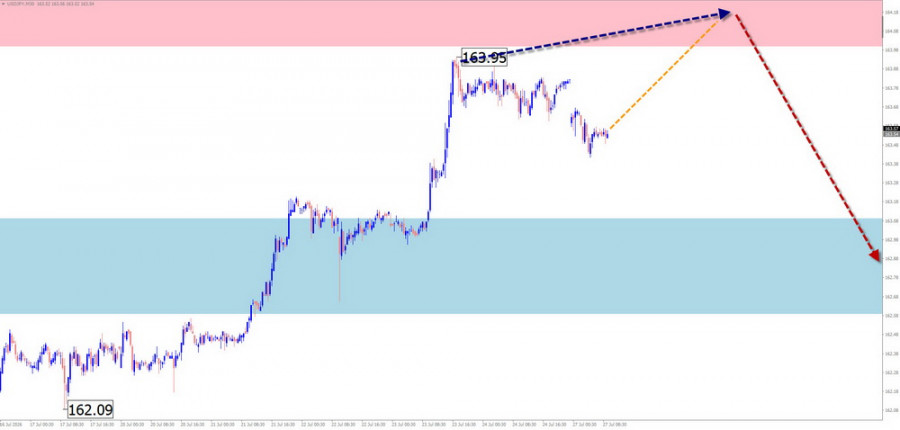
The major USD/JPY pair has been developing an upward wave since January this year. The latest unfinished part of the primary trend began on July 2. The pair has entered a major higher-timeframe potential reversal zone. In recent days, the price has started forming the initial stage of a pullback with reversal potential.
Forecast
The pair is expected to continue trading sideways over the coming days. A move higher towards the resistance zone remains likely. By the end of the week, the probability of a reversal will increase, with prices potentially declining towards the projected support zone.
Potential Reversal Zones
Resistance:
- 164.00–164.50
Support:
- 163.10–162.60
Trading Recommendations
Buy: Short-term buying opportunities may be considered. Using a reduced position size is recommended.
Sell: Selling opportunities may be considered after reversal signals appear in the resistance level.
GBP/JPY
Analysis
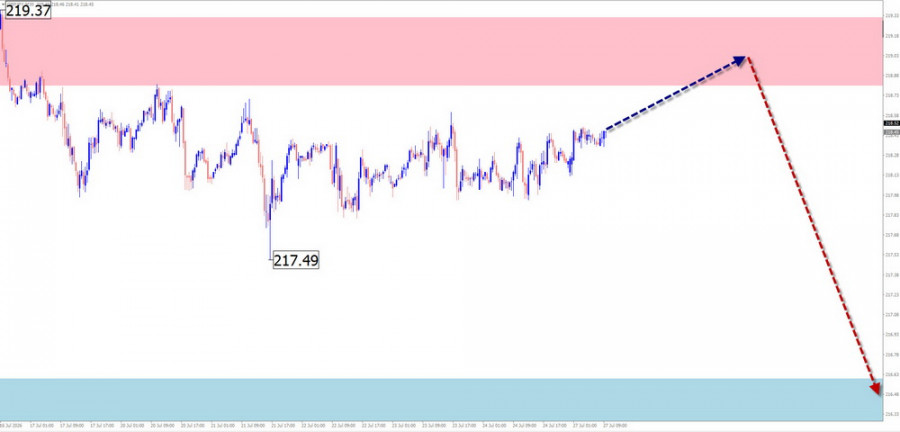
The GBP/JPY pair has remained in an upward trend since the end of April this year. The wave structure appears to be fully formed. In recent weeks, the pair has been trading near the lower boundary of a strong weekly potential reversal zone. The unfinished corrective wave that began on July 15 has reversal potential.
Forecast
The pair is expected to continue moving sideways throughout the coming week. Another test of the resistance zone cannot be ruled out. On Friday or early next week, the probability of a reversal and the beginning of a downward move will increase.
Potential Reversal Zones
Resistance:
- 218.80–219.30
Support:
- 216.60–216.10
Trading Recommendations
Buy: Buying positions may be relatively risky and could result in losses.
Sell: Selling opportunities will become relevant after confirmed reversal signals appear in the reversal zone.
USD/CAD
Analysis
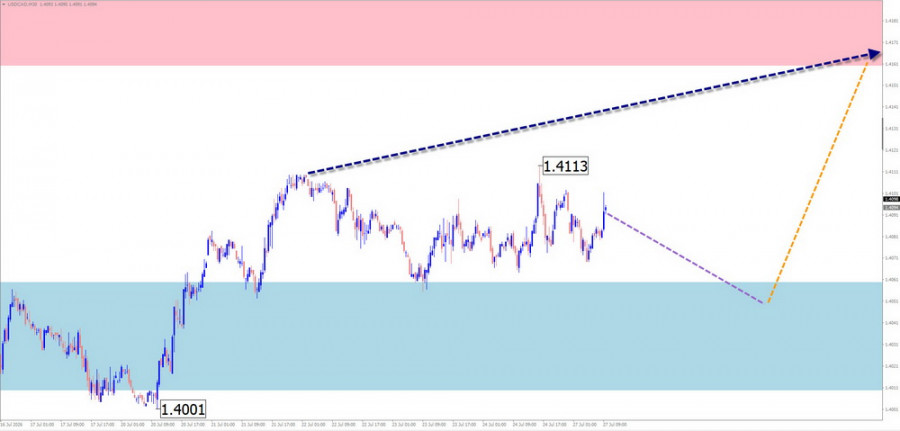
The major USD/CAD pair continues to develop a descending running flat correction that has been unfolding since the middle of June. Over the past week, the pair has been drifting around the convergence of potential reversal zones across different timeframes. The wave extremes are forming an expanding triangle pattern. The current wave structure is still missing its final segment.
Forecast
A sideways movement is expected over the next couple of days, with a possible decline towards the support zone. A reversal may then begin. During the second half of the week, the probability of a resumption of the bullish trend will increase.
Potential Reversal Zones
Resistance:
- 1.4160–1.4210
Support:
- 1.4060–1.4010
Trading Recommendations
Buy: For optimal entry, monitor any emerging reversal signals near the projected support zone.
Sell: Selling is risky and offers limited potential.
NZD/USD
Brief Analysis
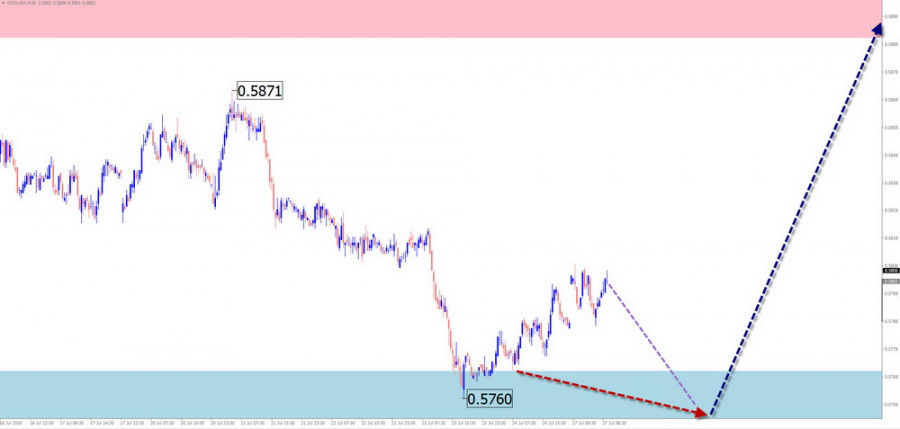
Price action in the NZD/USD major pair has been driven by a bearish wave since the end of May. During the past three weeks, the pair has been forming the middle wave (B), which remains incomplete at the time of writing. The latest unfinished downward part has been developing since July 24.
Weekly Forecast
At the beginning of the week, further downside is likely until the price reaches the support zone. A reversal and renewed upward movement are expected closer to the weekend. The projected resistance zone is expected to limit the week's recovery.
Potential Reversal Zones
Resistance:
- 0.5890–0.5940
Support:
- 0.5770–0.5720
Trading Recommendations
Sell: Short-term selling may be considered with caution using a reduced position size.
Buy: Buying opportunities may emerge after reversal signals appear in the support zone.
Gold
Analysis
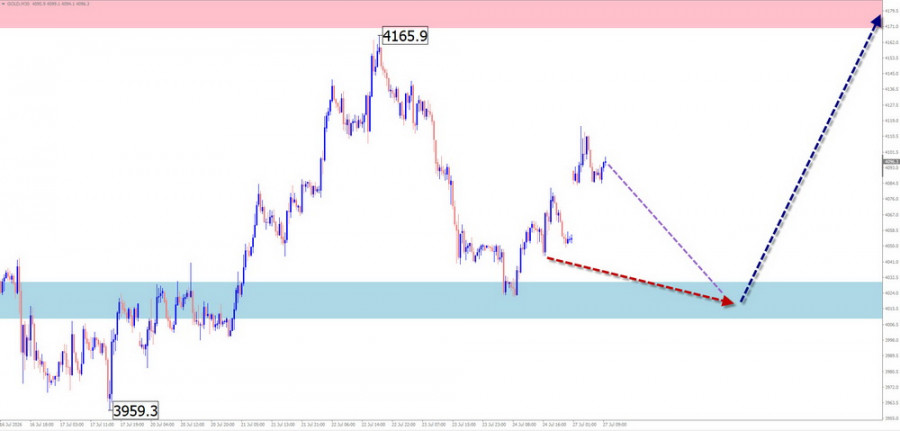
In the short term, gold has remained under pressure from a bearish wave that has been developing since the end of January. Within the broader wave structure, this movement represents a correction. Over the past six weeks, gold has been trading sideways after breaking above the upper boundary of the descending channel that had previously contained the downtrend.
Forecast
Gold is expected to continue trading sideways through the end of the week. During the first few days, a brief test of the support zone remains possible. A reversal may then develop, with an upward move likely towards the end of this week or during the following week.
Potential Reversal Zones
Resistance:
- 4170.0–4220.0
Support:
- 4030.0–3980.0
Trading Recommendations
Buy: Buying opportunities will become relevant after confirmed reversal signals appear within the reversal zone.
Sell: Selling may be risky and could result in trading losses.
Notes
In the Simplified Wave Analysis (SWA) methodology, every wave consists of three parts: A-B-C. On each timeframe, the analysis focuses on the latest unfinished wave. The dotted lines indicate the expected direction of price movement.
Attention: The wave algorithm does not take into account the duration of market movements over time.
Смотрите также