analytics1_1
Trading Recommendations and Trade Analysis for EUR/USD on September 2. The Dollar is Moving Towards Success
Trading Recommendations and Trade Analysis for EUR/USD on September 2. The Dollar is Moving Towards Success
Trading plan
2026-09-02 04:07:04
EUR/USD Analysis 5M
The EUR/USD currency pair resumed its downward movement on Tuesday. Although the decline has been mild, it has persisted for a week and a half. It is timely to ask what grounds there are for the strengthening of the American currency. Essentially, the market can only buy dollars on the belief that the Federal Reserve will tighten monetary policy. However, Kevin Warsh's speech, which reignited this belief in traders, occurred only last Friday, while the pair's decline started much earlier. Thus, we are primarily dealing with a basic technical correction rather than a market belief.
Yesterday, for example, two interesting reports were published in the U.S. The ISM manufacturing index came in lower than expected, and the JOLTS report on job openings also showed a weaker result. Consequently, there were no grounds for the dollar to rise. Meanwhile, in the Eurozone, inflation rose to 3.3%, significantly increasing the likelihood of European Central Bank monetary policy tightening in September. Nonetheless, by the end of the day, it was the dollar that appreciated, not the euro. We believe the current situation is more indicative of a technical correction. The fundamentals for the dollar have not changed much in recent weeks.
From a technical standpoint, the pair has begun a new downward trend after breaching the ascending trend line. A new descending trendline has been formed. Therefore, in the near future, the pair may continue to decline. This week will see many important data published in the U.S., but the market already shows that only the Nonfarm Payrolls report is of interest.
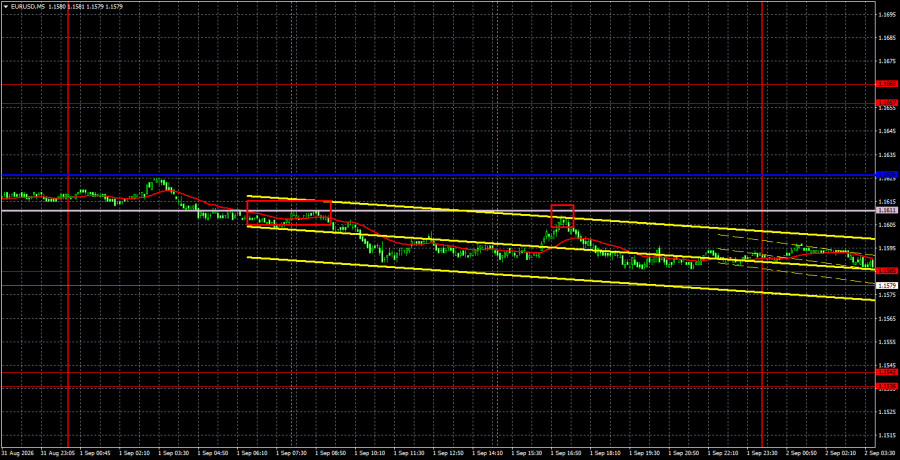
On the 5-minute timeframe on Tuesday, two weak sell signals were formed. The price rebounded twice from the Senkou Span B line, allowing traders to open short positions. In both cases, the pair reached the nearest target level of 1.1585. However, volatility was again low.
COT Report
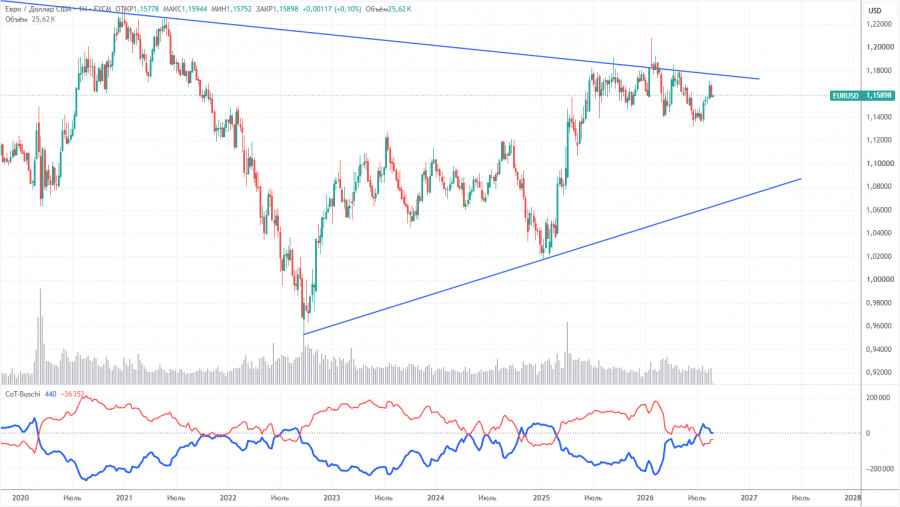
The latest COT report is dated August 25. The illustration of the weekly timeframe shows that the net position of non-commercial traders has turned "bearish" and has significantly decreased in 2026 due to geopolitical events. Traders have been getting rid of the European currency in favor of the U.S. dollar in recent months. Donald Trump's policy remains unchanged, but the dollar served for a time as a "reserve currency."
We still do not see any fundamental factors that would strengthen the American currency. The war in the Middle East temporarily made the dollar very attractive, but when this factor reaches its "expiration date," everything will return to normal. This process may have already concluded. In the long term, the euro could fall to the 1.08$ level (trend line), but the upward trend will remain relevant. Over the last months of dollar growth, the pair has not approached this line significantly.
The positions of the red and blue lines of the indicator suggest an approximate parity between bulls and bears. Over the last reporting week, the number of longs in the "Non-commercial" group increased by 2,700, while the number of shorts decreased by 20,000. Consequently, the net position grew by 22,700 contracts during the week.
EUR/USD Analysis 1H
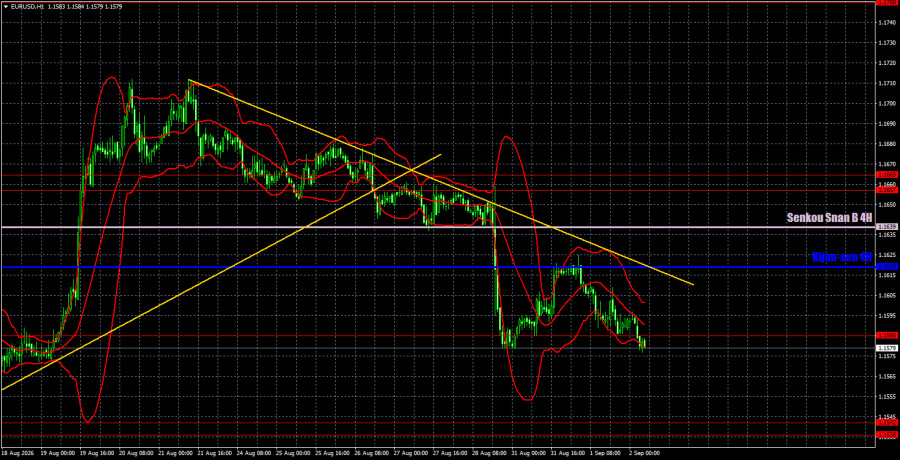
On the hourly timeframe, the EUR/USD pair interrupted its upward trend last Friday. The situation in the Middle East remains tense and has not improved, but this is not enough for a new, strong rise in the dollar. Warsh's speech and the annual Nonfarm Payrolls supported the dollar, but we do not see significant reasons for optimism or excellent prospects for the American currency. This week, the dollar continues to rise, but it is more a matter of technical necessity to correct.
For September 2, we highlight the following levels for trading — 1.1234, 1.1274, 1.1362-1.1368, 1.1461-1.1473, 1.1536-1.1542, 1.1585, 1.1657-1.1665, 1.1750-1.1760, 1.1786, 1.1830-1.1837, as well as the Senkou Span B line (1.1611) and Kijun-sen (1.1626). The lines of the Ichimoku indicator may move throughout the day, which should be considered when determining trading signals. Don't forget to set a stop-loss order to break even if the price moves 15 pips in the right direction. This will protect against potential losses if the signal proves false.
On Wednesday, the calendar of macroeconomic and fundamental events in the Eurozone is empty. In the U.S., the ADP labor market report will be released; it is considered a secondary indicator. We do not expect the market to react to this report, so volatility today may remain low, and the corrective sentiment will likely persist.
Trading Recommendations:
Today, traders may consider short positions targeting 1.1536-1.1542 if the price settles below 1.1585. A consolidation above the lines of the Ichimoku indicator will allow for the opening of long positions targeting 1.1657-1.1665 and above.
Explanations for Illustrations:
- Price Levels (Support and Resistance) – thick red lines where movement may conclude. They are not sources of trading signals.
- Kijun-sen and Senkou Span B Lines – Ichimoku indicator lines transferred to the hourly timeframe from the 4-hour timeframe. They are strong lines.
- Extreme Levels – thin red lines from which the price has previously rebounded. They are sources of trading signals.
- Yellow Lines – trend lines, trending channels, and any other technical patterns.
- Indicator 1 on COT Charts – the size of the net position of each category of traders.
Смотрите также