Overview of the GBP/USD Pair. September 30. The Pound Sterling Holds On by a Thread
Fundamental analysis
2026-09-30 03:09:03
The GBP/USD pair traded lower on Tuesday as well, which by now probably surprised no one. The market situation has generally not changed in recent weeks. Experts keep talking about the strength of the US economy (even though GDP growth rates are falling), about high inflation in the US (even though it has been slowing in recent months), about rising geopolitical tension (even though active military operations are not currently underway in the Middle East), about rising European bond yields (even though in the US that same indicator has been hitting 20-year extremes almost daily), and about Federal Reserve monetary tightening (even though the European Central Bank is also raising rates). So if you really want to explain any movement, you can close your eyes to the obvious facts. Convenient.
No one remembers Trump's trade war, yet the US president raised tariffs on Canada to 50% in September. But the market only sees a deal between China and the US that reduced some tariffs. While Trump is in a good mood, no one notices the huge US government debt, the massive budget problems, the still negative trade balance, or the fact that the government is already forced to spend roughly a trillion dollars of budget money servicing its own debt.
Treasury yields are rising for a reason: demand for US government paper is falling. Rates have to be raised constantly to attract borrowed capital. This indicator shows how much foreign and domestic investors trust the Trump administration and believe in a "golden age." The US stock market can rise because it lists private companies unrelated to the government. The AI sector indeed draws huge investment, much like Bitcoin once did. But that's the private market — the public side remains dire.
This week a series of US labour-market reports will be released, and at the start of the week the market expects strong readings. In our view, anything can happen, because even leading global economists often fail to predict key numbers. Therefore, NFP, the unemployment rate, ISM, and PCE may come in with big surprises. But what difference does it make if the market is confident in its forecasts that point to aggressive Fed tightening?
Recall that FOMC officials themselves expect at least one more hike, and in 2027 a easing cycle may resume. So if the market is now pricing in Fed tightening in advance, will it soon start pricing in pre-emptive easing for 2027? If the market currently ignores ECB or Bank of England tightening, will it later ignore ECB or BoE easing? In any case, the dollar is set to fall — unless another flock of "black swans" appears, as happened twice already this year.
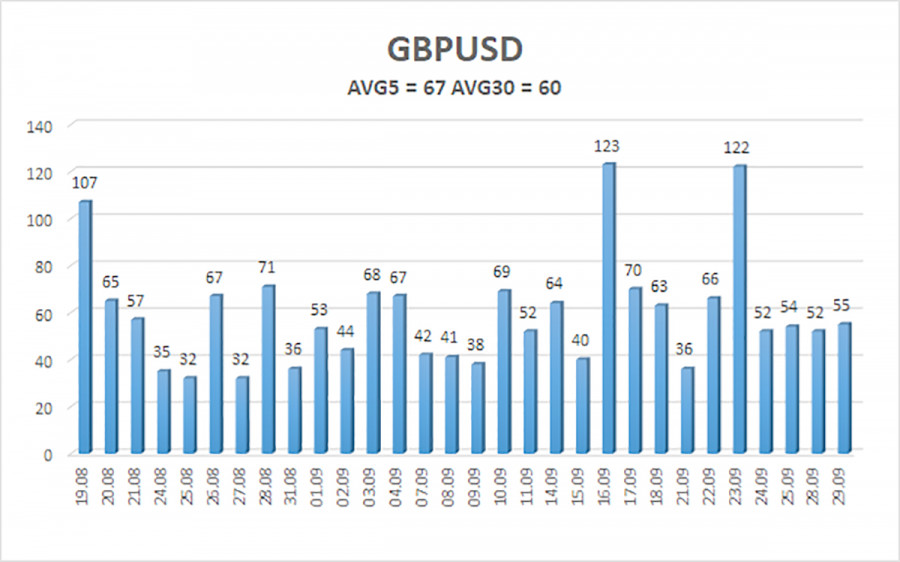
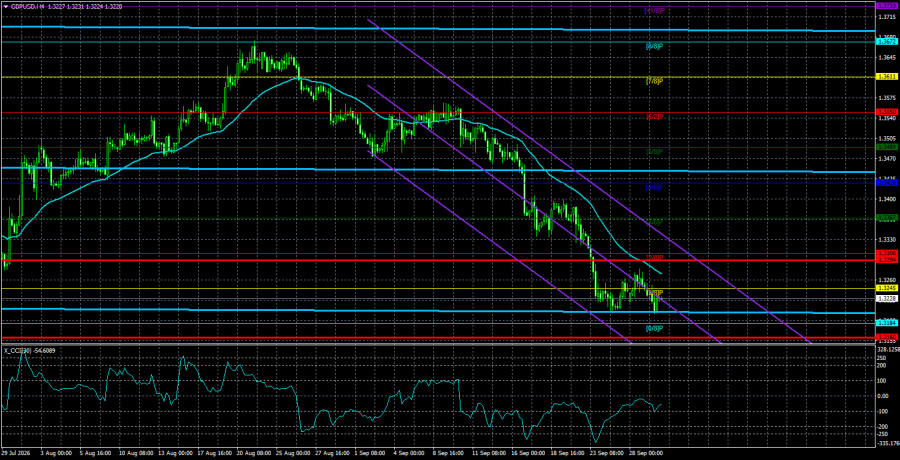
The average volatility of the GBP/USD pair over the last 5 trading days is 67 pips. For the pound/dollar pair, this value is characterized as "average." On Wednesday, September 30, therefore, we expect movement within the range bounded by 1.3160 and 1.3294. The higher linear-regression channel is pointing upward, indicating an uptrend. The CCI indicator has entered the oversold area twice, warning of a possible end to the downward trend.
Nearest support levels:
S1 – 1.3184
S2 – 1.3123
S3 – 1.3062
Nearest resistance levels:
R1 – 1.3245
R2 – 1.3306
R3 – 1.3367
Trading Recommendations:
The GBP/USD pair continues its illogical downward movement. Donald Trump's policies will continue to pressure the US economy, so we do not expect long-term gains from the US dollar. 2026 has been positive for the dollar so far due to geopolitics and inflation, which forced capital to seek refuge and prompted the Fed to return to tightening monetary policy. However, on the weekly timeframe, a flat range between 1.3150 and 1.3780 persists within a four-year uptrend, supporting expectations of pound appreciation in the medium term. Consider long positions with targets of 1.3367 and 1.3428 when price is above the moving average. Price below the moving average allows bearish trading, with targets of 1.3160 and 1.3123.
Explanations for Illustrations:
Regression channels help determine the current trend. If both are directed in the same direction, it means the trend is currently strong;
The moving average line (settings 20,0, smoothed) defines the short-term trend and the direction in which trading should be conducted at present;
Murray levels are target levels for moves and corrections;
Volatility levels (red lines) are the probable price channel within which the pair will spend the next 24 hours based on current volatility indicators;
The CCI indicator – its entry into the oversold area (below -250) or the overbought area (above +250) indicates that a trend reversal in the opposite direction is approaching.
Смотрите также