analytics1_1
How to Trade The EUR/USD Currency Pair on October 16? Simple Tips and Trade Analysis for Beginners
How to Trade The EUR/USD Currency Pair on October 16? Simple Tips and Trade Analysis for Beginners
Trading plan
2026-10-16 02:35:07
Review of Thursday's trades:
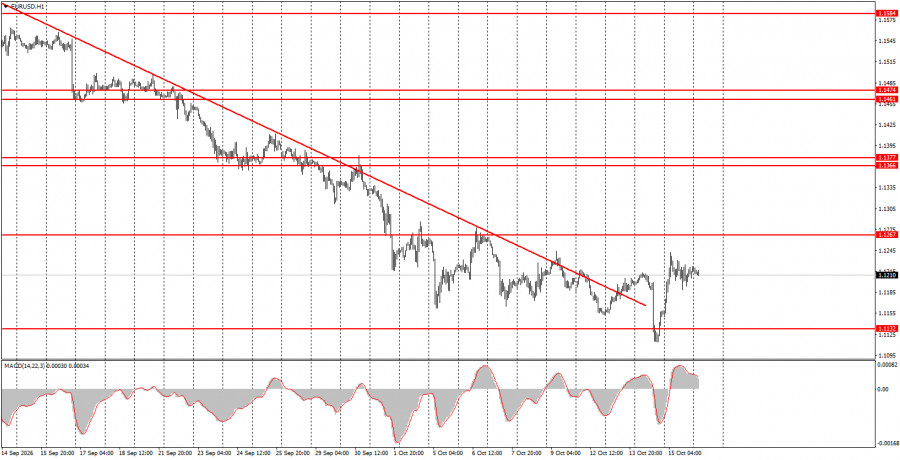
1H chart of the EUR/USD pair
The EUR/USD currency pair basically stood still all day Thursday, aside from an overnight rally as part of a double reaction to the recent US inflation reports. Recall that on Wednesday the market began fresh active dollar buying after the slightly hotter-than-expected September inflation print. Yet within a few hours the dollar was sold off, surprising many analysts. In our view, nothing about this is mysterious. The US dollar has risen almost every day for almost a month, and the market has already priced in virtually every possible bullish factor for the greenback. Euro-positive fundamentals and macro data remain ignored, so Wednesday's move was a routine retracement driven by profit-taking on some short positions. As for Thursday, the 5-minute chart clearly shows price moved sideways throughout the European and US sessions. Accordingly, there was no meaningful reaction to Eurozone industrial-production data or to US PPI and retail-sales releases.
5M chart of the EUR/USD pair
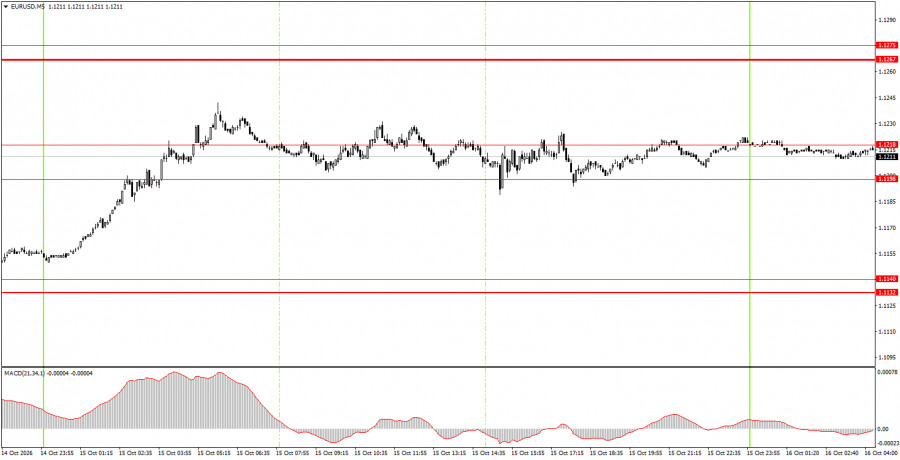
On the 5-minute timeframe, Thursday produced no trading signals; price traded sideways almost all day inside the 1.1198–1.1218 area. Volatility was minimal and macro events were largely ignored.
How to trade on Friday:
On the hourly timeframe, EUR/USD retains a downward tendency that qualifies as a full trend despite the recent trendline breach. Given recent events, we do not believe the euro should be collapsing like a stone. Yet the market keeps buying the US dollar regardless of events, releases, or their content.
On Friday, novice traders may consider new short positions if price closes below the 1.1198–1.1218 area, targeting 1.1132–1.1140. Open long positions on a close above the 1.1198–1.1218 area, targeting 1.1267–1.1275.
On the 5-minute timeframe consider the levels 1.1011, 1.1088, 1.1132–1.1140, 1.1198–1.1218, 1.1267–1.1275, 1.1366–1.1377, 1.1461–1.1474, 1.1527–1.1531, 1.1584–1.1594, 1.1655–1.1665. On Friday, the Eurozone will publish the second estimate of September inflation, the US Federal Reserve chair, Kevin Warsh, will speak (in the morning), and industrial-production data will be released. The Fed chair's remarks can trigger market volatility.
Key Rules of the Trading System:
- The strength of a signal is determined by the time it takes to form the signal (rebound or breakout). The less time taken, the stronger the signal.
- If two or more trades were opened at a certain level based on false signals, all subsequent signals from that level should be ignored.
- In a range (flat), any pair can generate many false signals or may not produce any at all. Technical levels may be disregarded.
- On the hourly timeframe, trading signals from the MACD indicator should be acted upon only when volatility is high, and a trend line or trend channel confirms the trend.
- If two levels are too close together (within 5-20 pips), treat them as a support or resistance area.
- After moving 15 pips in the right direction, a stop-loss should be set to break even.
What to Look for on the Charts:
Price levels (areas) of support and resistance serve as targets for opening buy or sell trades or as sources of signals.
Red lines indicate channels or trend lines that show the current trend and the preferred trading direction.
The MACD indicator (14,22,3) — the histogram and signal line — is an auxiliary indicator that can also provide signals.
Important speeches and reports (listed in the news calendar) can significantly influence currency pair movements. Therefore, during their release, traders should approach trading with utmost caution, or exit the market to avoid sudden reversals against the preceding move.
Beginner forex traders should remember that not every trade can be profitable. Developing a clear strategy and practicing money management are key to long-term success in trading.
Смотрите также