
analytics1_1

Technical Analysis of Daily Price Movement of Ripple Cryptocurrency, Friday November 01, 2024.
Technical Analysis of Daily Price Movement of Ripple Cryptocurrency, Friday November 01, 2024.

Crypto-currencies
2024-11-01 04:21:18

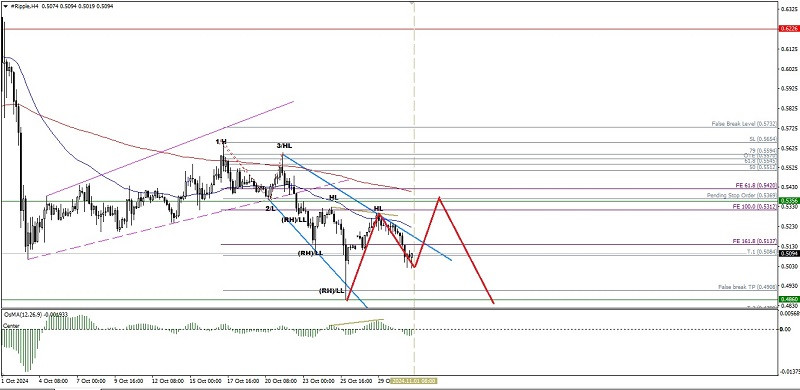
The condition of the Ripple cryptocurrency on its 4-hour chart is currently under Seller pressure, as seen by the EMA 50 & EMA 200 still intersecting the Death Cross, coupled with the appearance of the Bearish 123 pattern followed by several Ross Hooks (RH) and its price movements forming Higher-Low and Lower-Low coupled with the appearance of hidden deviations between Ripple's price movements and the MACD Histogram indicator (osMA 12,26,9), then confirm that Sellers are currently dominating Ripple on its 4-hour chart, but with the appearance of the Descending Broadening Wedge pattern, it is also worth being aware that in the near future there will be temporary strengthening where there is potential for Ripple to retrace up to the level of 0.5369, but as long as the strengthening does not penetrate and close above the level of 0.5594, Ripple will continue its weakening back to the level of 0.4908 as its main target and if momentum and volatility support it, 0.4799 will be the next target to be aimed of.
(Disclaimer)
Смотрите также


