analytics1_1
How to Trade the EUR/USD Pair on February 5? Simple Tips and Trade Analysis for Beginners
How to Trade the EUR/USD Pair on February 5? Simple Tips and Trade Analysis for Beginners
Trading plan
2025-02-05 05:23:02
Analysis of Tuesday's Trades
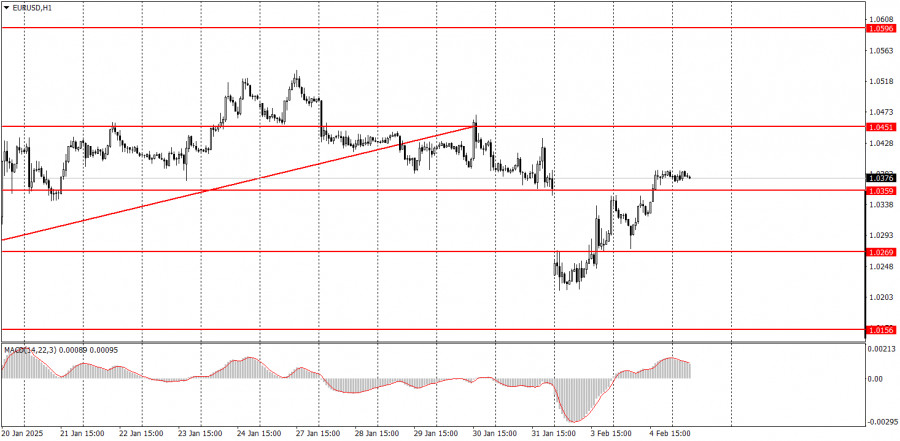
1H Chart of EUR/USD
On Tuesday, the EUR/USD currency pair continued its upward movement, aligning with several key factors. First, a bullish correction is ongoing on the daily timeframe. Despite a market crash triggered by Donald Trump's actions over the weekend, the correction has neither ended nor been canceled. Secondly, there is a need to close the gap that formed on Monday. Additionally, Tuesday's macroeconomic data provided support for the euro. The sole report released that day—the JOLTs job openings—came in weaker than expected. While we don't consider this report particularly significant, the market is currently inclined toward growth, leading to increased buying of the euro. With numerous events and releases scheduled for this week, we anticipate high volatility for the pair. Nonetheless, we expect the correction to continue.
5M Chart of EUR/USD
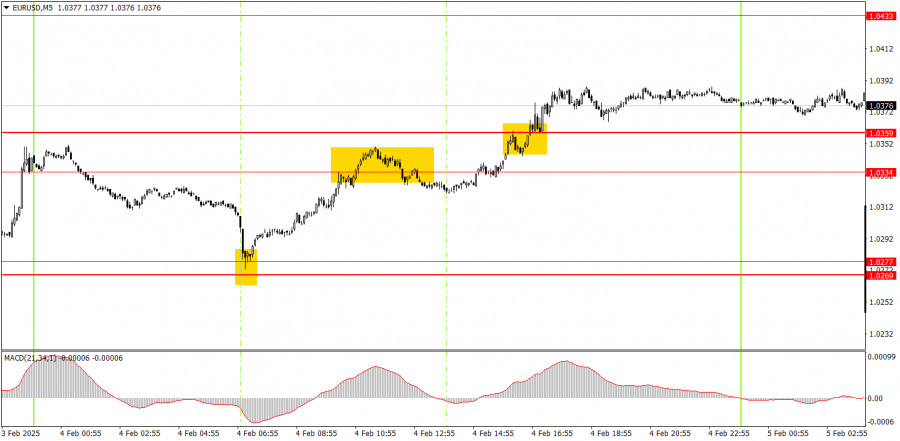
On the 5-minute timeframe, several interesting trading signals formed on Tuesday. At the start of the European trading session, the price rebounded from the 1.0269–1.0277 area and then rose to the 1.0334–1.0359 area. However, the rebound from this area turned out to be a false signal, resulting in a small loss from the short position. Shortly after, the pair broke through this area, which allowed novice traders to open new long positions. This trade was profitable if closed in the evening, although traders could also choose to carry it over to Wednesday. In total, two out of the three signals were profitable.
Trading Strategy for Wednesday:
On the hourly timeframe, the EUR/USD pair remains in a medium-term downtrend. Although the local uptrend was briefly interrupted, it has since resumed. A decline in the euro is still expected, given that both the fundamental and macroeconomic factors continue to support the U.S. dollar. However, the bullish correction on the daily timeframe may persist for several more weeks.
On Wednesday, the pair's growth may continue, but one should focus on technical levels. The current rise in the euro is a correction, albeit one on a higher timeframe. On the hourly chart, this correction may appear complex, characterized by alternating trends.
On the 5-minute timeframe, the following levels should be noted: 1.0156, 1.0221, 1.0269–1.0277, 1.0334–1.0359, 1.0433–1.0451, 1.0526, 1.0596, 1.0678, 1.0726–1.0733, 1.0797–1.0804, and 1.0845–1.0851. On Wednesday, the services PMI indices will be published for the Eurozone, Germany, and the U.S. Notably, we should pay attention to the ISM Services Index in the U.S. and the ADP U.S. labor market report. Currently, the market indicates a bias toward growth.
Core Trading System Rules:
- Signal Strength: The shorter the time it takes for a signal to form (a rebound or breakout), the stronger the signal.
- False Signals: If two or more trades near a level result in false signals, subsequent signals from that level should be ignored.
- Flat Markets: In flat conditions, pairs may generate many false signals or none at all. It's better to stop trading at the first signs of a flat market.
- Trading Hours: Open trades between the start of the European session and the middle of the US session, then manually close all trades.
- MACD Signals: On the hourly timeframe, trade MACD signals only during periods of good volatility and a clear trend confirmed by trendlines or trend channels.
- Close Levels: If two levels are too close (5–20 pips apart), treat them as a support or resistance zone.
- Stop Loss: Set a Stop Loss to breakeven after the price moves 15 pips in the desired direction.
Key Chart Elements:
Support and Resistance Levels: These are target levels for opening or closing positions and can also serve as points for placing Take Profit orders.
Red Lines: Channels or trendlines indicating the current trend and the preferred direction for trading.
MACD Indicator (14,22,3): A histogram and signal line used as a supplementary source of trading signals.
Important Events and Reports: Found in the economic calendar, these can heavily influence price movements. Exercise caution or exit the market during their release to avoid sharp reversals.
Forex trading beginners should remember that not every trade will be profitable. Developing a clear strategy and practicing proper money management are essential for long-term trading success.
Смотрите также