EUR/USD Overview. November 6. The Eurocurrency Continues Its Technical Correction
Fundamental analysis
2025-11-06 01:08:45
The EUR/USD currency pair traded very weakly again on Wednesday, maintaining a downward inclination. The only significant events of the day included the ISM services activity index from the U.S. and the ADP report, which is now the only report on which market participants can base their judgments about the U.S. labor market. However, we will discuss macroeconomic data further on. In this article (despite its fundamental nature), we will focus on the most important factor driving the pair down for over a month.
The daily timeframe best illustrates the current situation on the currency market. We frequently mention this because it is indeed true. It is worth recalling that trading schools always teach beginners to start their analysis from higher timeframes. So, what do we see on the higher timeframes?
Let's start not with the daily but with the weekly timeframe. On the weekly timeframe (the illustration is presented in the article on trading recommendations for EUR/USD), we see a descending trend line and an upward trend. The trend line that originated in February 2018 and the upward trend that started in September 2022. During the current upward trend, the price rebounded off the trend line in September, as expected based on technical analysis. Since then, we have observed a decline (for a month and a half now), leaving many analysts scratching their heads and coming up with the most improbable explanations.
Now, let's switch to the daily timeframe. Since July 1, the price has been moving in a flat pattern. And not just in a flat pattern, but one at high levels. This flat can be bounded by the levels of 1.1400 and 1.1830. Why is the current decline, which has lasted for a month and a half, considered a flat? Let's turn to a method commonly used in any trading school. It is well known that trending movements are quick, sharp, and strong. Accordingly, corrections are slow and weak. If we measure from the last peak to the current price, it turns out that the European currency has declined by 430 pips over 35 trading days. However, the correction began not a month and a half ago but on July 1. Consequently, it has lasted for 91 trading days. Thus, on average, the euro depreciates by five pips each day.
Now let's calculate how quickly the euro rose in the first half of this year. The growth began at 1.0180 and ended at 1.1830. Thus, over 121 trading days, the euro rose by 1,650 pips, which means an average daily increase of 14 pips. As we can see, the trending movement is three times stronger than the correction. Furthermore, the correction on the daily timeframe is still not over. If the upward trend took about six months, the correction may last even longer. It doesn't always happen this way, but it is indeed possible. Therefore, we maintain our initial opinion: the current movement is technical and corrective. The upward trend is still intact.
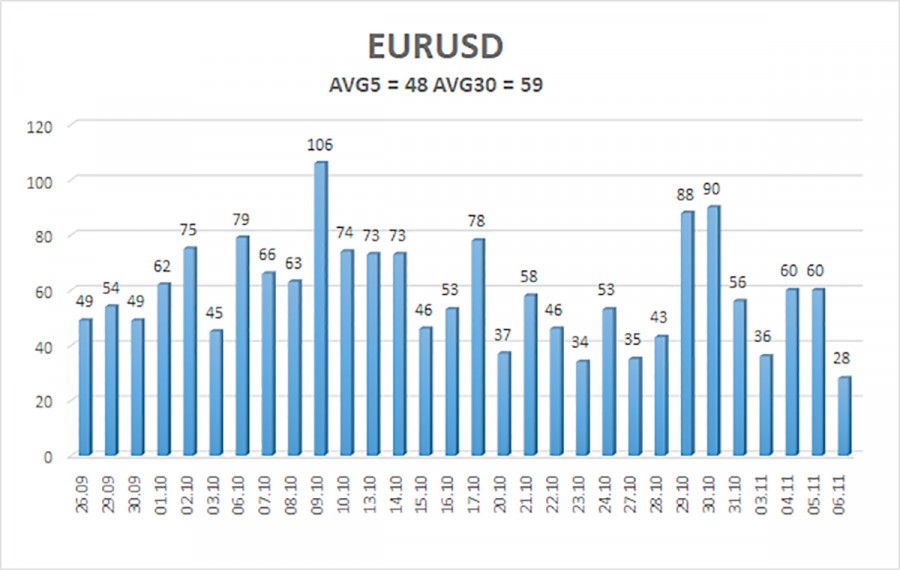
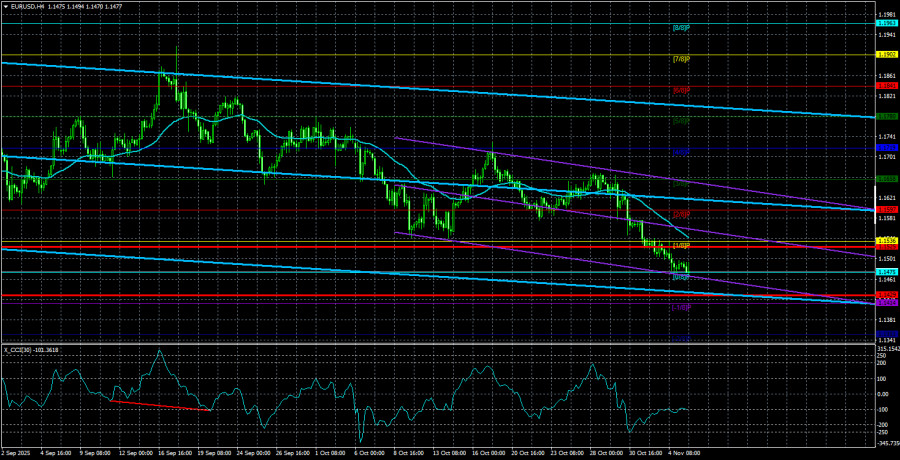
The average volatility of the EUR/USD currency pair over the last five trading days, as of November 6, is 48 pips and is characterized as "low." We expect the pair to move between 1.1429 and 1.1525 on Thursday. The upper linear regression channel is pointing downward, signaling a bearish trend, yet the daily timeframe remains flat. The CCI indicator entered the oversold territory twice in October (!!!), which may provoke a new upward trend.
Nearest Support Levels:
- S1 – 1.1475
- S2 – 1.1414
- S3 – 1.1353
Nearest Resistance Levels:
- R1 – 1.1536
- R2 – 1.1597
- R3 – 1.1658
Trading Recommendations:
The EUR/USD pair is making attempts from time to time to initiate a new upward trend on the 4-hour timeframe, but overall, it continues to decline. The upward trend remains intact on higher timeframes, but the daily timeframe has been flat for several months. The U.S. dollar is still significantly affected by the global fundamental environment. Recently, the dollar has been rising, but local reasons are at least ambiguous. However, the flat nature of the daily timeframe explains everything. When the price is below the moving average, small short positions can be considered with targets at 1.1429 and 1.1414 on purely technical grounds. Above the moving average line, long positions remain relevant with targets at 1.1841 and 1.1902 to continue the trend.
Explanations for Illustrations:
- Linear regression channels help determine the current trend. If both are directed in the same way, it indicates that the trend is currently strong.
- The moving average line (settings 20,0, smoothed) defines the short-term trend and the direction in which trading should currently be conducted.
- Murray levels are target levels for movements and corrections.
- Volatility levels (red lines) represent the likely price channel in which the pair will spend the following days, based on current volatility indicators.
- The CCI indicator entering the oversold territory (below -250) or overbought territory (above +250) indicates that a trend reversal in the opposite direction is approaching.
Смотрите также