Trading recommendations for Bitcoin on January 13, according to the ICT system
Crypto-currencies
2026-01-13 07:21:52
Bitcoin continues to clearly follow the technical picture. The correction continues, and the market remains flat. Recall that Bitcoin has been in a sideways channel since December 1. Thus, for a month and a half, the primary cryptocurrency has been trading between $83,700 and $94,200. Several trading signals in the form of deviations of the sideways channel boundaries were formed, and in the illustration below, you can see that all signals were worked out to one degree or another. Recall that after a deviation is formed, there are two targets for the move — 50% of the sideways channel and 100%. Internal patterns inside the sideways channel do not matter.
Thus, in the current situation, only two development options remain. Either wait for the flat to end, or trade from its borders. Waiting for the flat to end can take a long time, so it is better to look for opportunities to open positions at the flat's boundaries. The downtrend on the daily TF persists, so we expect a resumption of the decline in "digital gold." From our point of view, Bitcoin's prospects for 2026 are rather uncertain. Many experts note weak demand for cryptocurrencies after October 10–11, 2025, when a total market crash occurred. Many also note declining demand among institutional investors and the disappearance of the "Bitcoin halving-driven growth" pattern. In other words, the regularities that previously allowed Bitcoin to grow no longer work.
Bitcoin must continue to gain popularity not only among retail traders and consumers, but also among large players and institutions as an international means of payment. Only then will its long-term growth continue. However, at present, institutions pay more attention to gold and silver, and retail traders were the most affected on October 10–11, and fear new crashes that could trigger margin calls. Therefore, trading volumes are currently at local minima, and Bitcoin is in a flat.
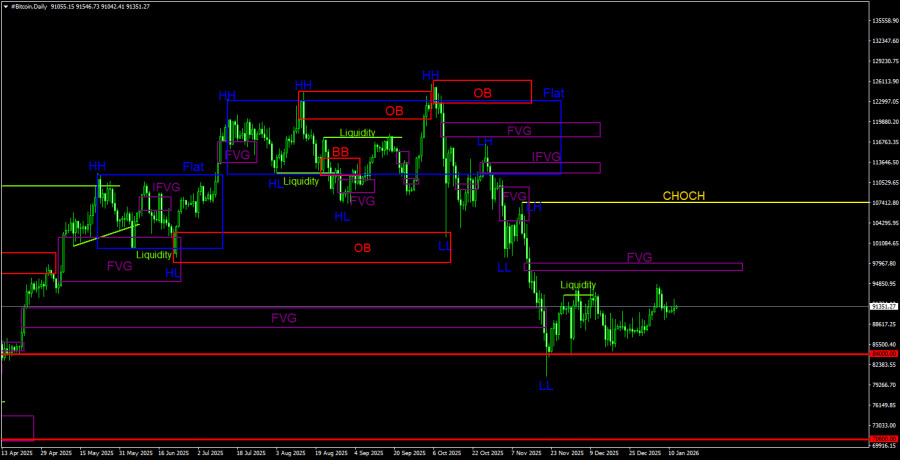
Overall picture BTC/USD on 1D
On the daily TF, Bitcoin remains in a downtrend as the correction continues. The trend structure is identified as downward; the June "bullish" OB was worked out; the April "bullish" FVG was overcome; and the $84,000 level (38.2% Fibonacci) — which we highlighted as a target — was reached. Further, Bitcoin could fall even to $60,000, from where its last ascent began. During the last wave, down one small "bearish" FVG was formed, which remains the only POI area for new sales. But Bitcoin has not yet managed to work out this pattern. However, there are two liquidity removals on the sell side immediately. But liquidity removal is not a signal, only a warning.
Overall picture BTC/USD on 4H
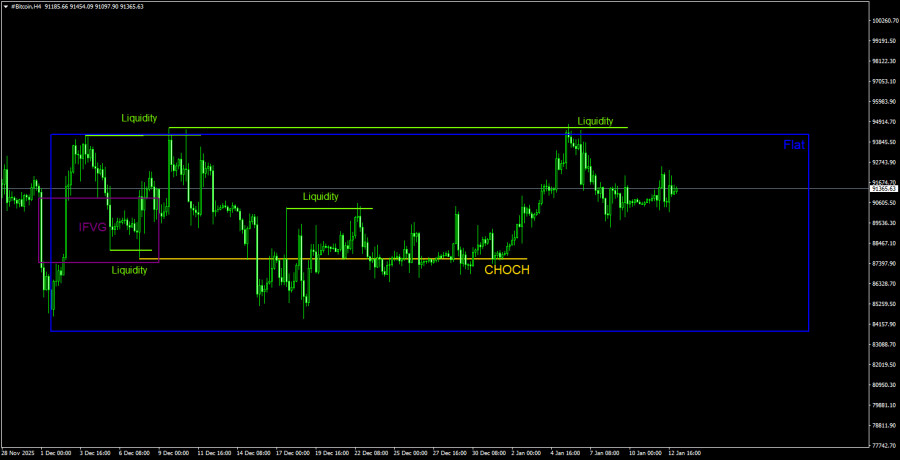
On the 4-hour timeframe, the price remains in a sideways channel. After the formation of the last sell signal near the upper boundary of the sideways channel, Bitcoin managed to work out one of its two targets — 50% of the sideways channel. At the start of the new week, Bitcoin is again moving toward the upper boundary of the flat, so it is possible that a new deviation and a new liquidity removal on the sell side will be formed in the coming days. Bitcoin has been relatively stable in recent months, but the outlook remains bearish.
Recommendations for trading BTC/USD:
Bitcoin broke the bullish structure on the daily TF and, for the first time in 3 years, began forming a full-fledged downtrend. The two nearest targets (the "bullish" OB in the $98,000–$102,700 area and the "bullish" FVG) have been worked out; now one should expect a fall to $70,800 (the 50.0% Fibonacci level of the three-year uptrend). Among the POI areas to sell, only the "bearish" FVG on the daily TF, located in the $96,800–$98,000 area, can be highlighted, which Bitcoin has not yet reached. On the 4-hour TF, a sell signal formed, and the $89,200 target was calculated. A new sell signal similar to the previous one may be formed in the near future. Or the flat may finally end.
Explanations for the illustrations:
CHOCH – break of the trend structure.
Liquidity – liquidity, traders' Stop Losses that market makers use to build their positions.
FVG – area of price inefficiency. Price passes through such areas very quickly, indicating a complete absence of one side in the market. Subsequently, the price tends to return and react to such areas.
IFVG – inverted area of price inefficiency. After returning to such an area, the price does not get a reaction from it but impulsively breaks through and then tests it from the other side.
OB – Order block. The candle on which the market maker opened a position in order to withdraw liquidity to form his own position in the opposite direction.
Смотрите также