Trading Recommendations for Bitcoin (BTC) on July 22 According to the ICT System
Crypto-currencies
2026-07-22 04:31:35
Bitcoin has recovered to $8,000 and is likely to continue moving toward the only bearish FVG on the daily chart. In any case, this is the only POI area for opening new short positions on the daily timeframe. It's important to remember that any rise in Bitcoin at this time is a correction, and this correction can end at any moment, not necessarily within any specific pattern. Bitcoin continues to trade close to its annual lows, and most independent and unbiased experts predict further declines. We fully agree with these forecasts and believe that the downtrend is not over. There are no signs of an end to the bearish trend: no bullish patterns or breaks in the bearish structure. The fundamental background also remains negative: the Federal Reserve does not intend to lower key rates in 2026, capital continues to flow into the AI sector, spot demand for Bitcoin remains weak, geopolitics is unstable, and miners are shifting their equipment to comply with the demands of artificial intelligence. We see no reason for a strong rise in "digital gold."
Meanwhile, the head of Grayscale's research department, Zach Pandl, stated that the current price of Bitcoin is a very good entry point. Likely, Pandl meant opening long positions, but he also mentioned that this would be "only under certain circumstances." Pandl believes that Bitcoin's future dynamics will depend on the Fed's monetary policy, the passage of the Clarity Act bill, and further actions by Strategy regarding Bitcoin. Recall that a few weeks ago, Strategy conducted its first significant sale of "digital gold," although it previously adhered to the principle of "never sell Bitcoin." The sale of Bitcoin proved unavoidable as the company's dollar reserves fell to unfavorable levels, prompting investors to worry. Strategy's actions serve as indicators of confidence for many investors. If even Michael Saylor's company has started selling Bitcoin, then the situation is dire. Overall, among the three conditions outlined by Pandl for Bitcoin's growth, we see none that could materialize in the near future.
General Picture of BTC/USD on the Daily (1D) Timeframe
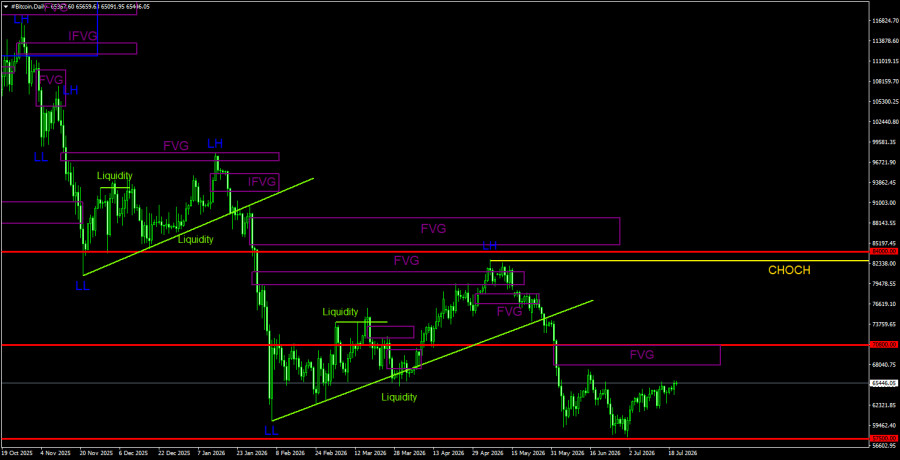
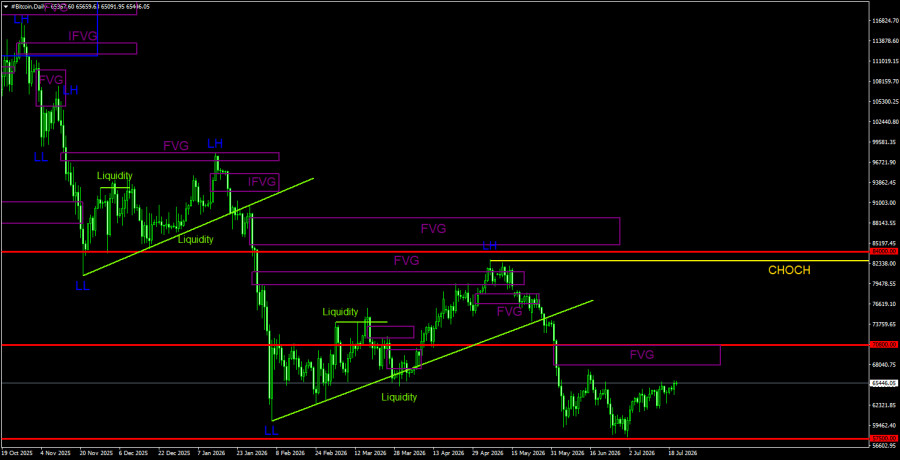
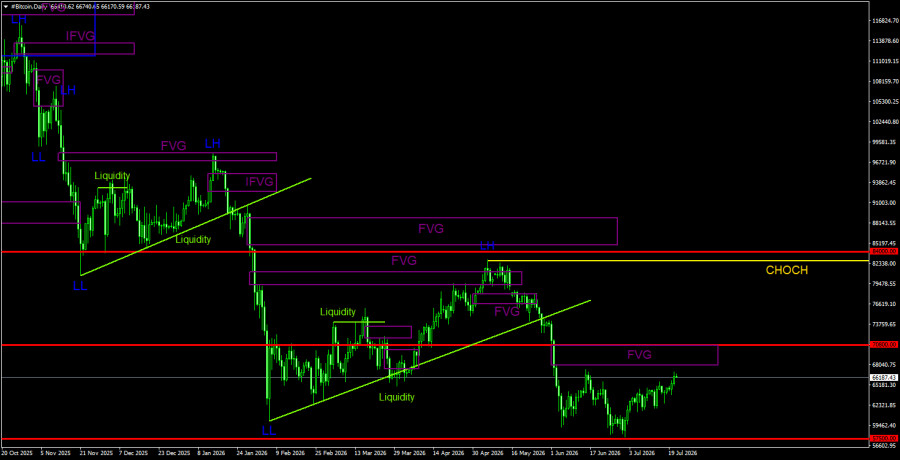
On the daily timeframe, Bitcoin continues to form a downward trend. The trend structure is identified as bearish, and the CHOCH line is now at $82,800, as a new LL (Lower Low) has been formed. Only above this level can it be considered that the downward trend has ended. Since there are still no signals of an upward trend reversal, we believe the decline will continue. A bearish FVG has been formed in the area between $68,000 and $70,700, which serves as the only POI area for sell positions.
General Picture of BTC/USD on the 4-Hour (4H) Timeframe
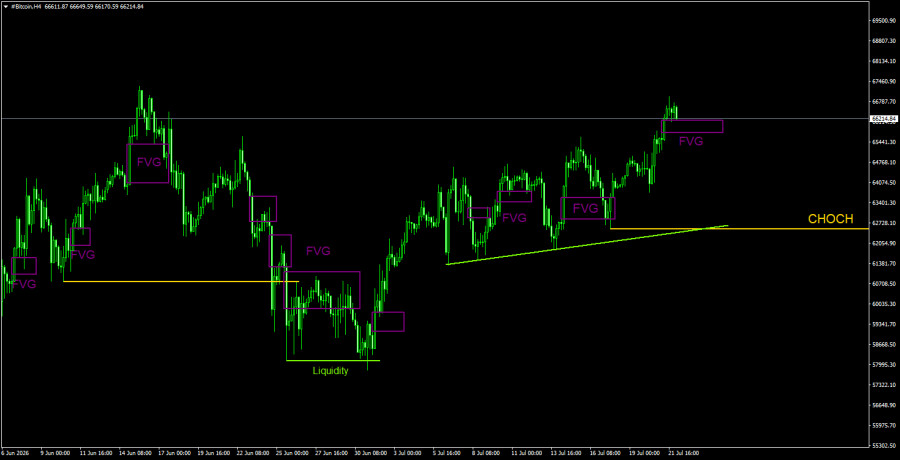
On the 4-hour timeframe, Bitcoin is in a downward trend; however, the overall correction is not yet complete. After liquidity was removed for buying, a price increase began, which we previously warned about. Recently, only small local FVGs have been formed, and reactions to them have typically been weak. The price reacted to the penultimate bullish FVG, allowing traders to open long positions. A new bullish FVG was formed yesterday. However, we remind you that any rise in Bitcoin now is a correction. Whether to engage in correction trading is a decision each trader must make. We also note a liquidity pool below the trend line, which the price is likely to reach with a 90% probability.
Trading Recommendations for BTC/USD:
Bitcoin continues to develop a full-fledged downward trend. We continue to expect a decline with a target of $57,500 (the 61.8% Fibonacci level from the three-year upward trend), although this level has essentially already been reached. However, we do not believe that the downward trend will end here. The last bearish FVG pattern was formed in the $68,000–$70,700 range on the daily timeframe; therefore, this area serves as the POI for short positions in the coming weeks. On the 4-hour timeframe, Bitcoin continues the second wave of correction, but sell trades remain more attractive since any rise is inherently a correction. However, short-term long positions are permissible.
Explanations for Illustrations:
CHOCH – the break in the trend structure.
Liquidity – Stop Loss, pending orders used by market makers to accumulate their positions.
FVG – Fair Value Gap. The price moves through such areas very quickly, indicating a complete absence of one side in the market. The price tends to return to these areas and reacts in continuation of the main trend.
IFVG – Inverted Fair Value Gap. After returning to such an area, the price does not react and breaks through impulsively, then tests it from the other side.
OB – Order Block. A candle in which the market maker opens a position to collect liquidity for forming its own position in the opposite direction.
Смотрите также