Trading Recommendations for the Cryptocurrency Market on August 19

Crypto-currencies
2026-08-19 07:04:08
While Bitcoin and Ethereum are making new attempts to rise and reach monthly highs, more information is emerging that the bearish market for cryptocurrencies is gradually approaching its conclusion.
For example, yesterday, VanEck published a report tracking 12 indicators, including MVRV Z-Score, net unrealized profit or loss, the Puell multiple, and the proportion of supply in profit. As of August 12, 2026, 8 out of 12 of these indicators were in the capitulation zone, and all 12 have touched this zone at least once in the past three months. At the same time, long-term holders reduced their holdings by approximately 356,000 bitcoins over the month, for the first time lowering their share of the total supply below 60%, while realized volatility decreased to 27.2%, indicating depletion of trading activity rather than its acceleration.
The report noted that the last three completed cycles of the bear market averaged about 11-13 months from peak to bottom, while the current correction, measured from the October 2025 high, is approximately in its 10th-11th month. This differs from an earlier calculation tied not to price but directly to the halving date, where the current day of the cycle also falls within the historical range of past lows.
An additional point from VanEck concerns the expected depth of the bottom itself. The company forecasts a noticeably shallower decline in this cycle compared to previous crashes, estimating it at 77-84%, citing the presence of spot Bitcoin ETPs, a much broader institutional base of holders, and the absence of mass collapses among major creditors and exchanges like FTX, Celsius, and Terra Luna, which previously exacerbated panic. The current pullback from the October peak is already about 47%, which is indeed significantly softer than any of the three previous cycles.
This aligns well with a recent observation from CryptoQuant about the drop in the proportion of profitable bitcoins to 51.4%, as well as the overall picture where the reduction of long-term holders' share below 60% could reflect a gradual transfer of coins from exhausted medium-term holders to new buyers entering the market at this phase of the cycle.
As for short-term trading, the strategy and conditions are described below.
Bitcoin
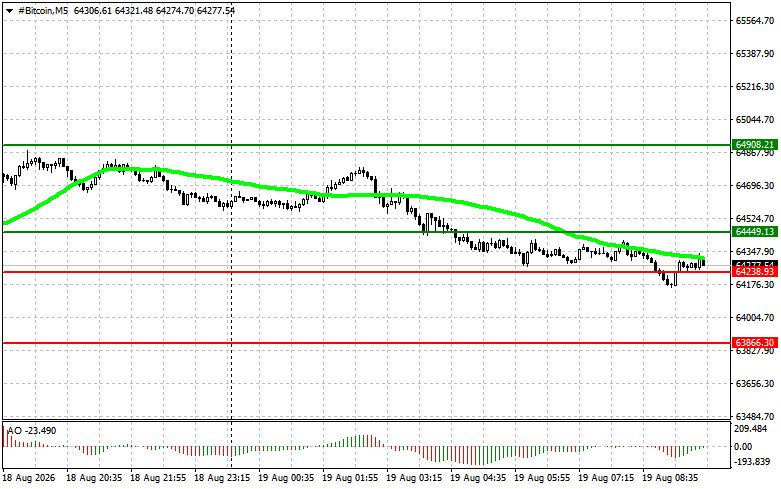
Buy Scenario
- Scenario No. 1: I plan to buy Bitcoin today when it reaches around $64,500, targeting a rise to $64,900. At around $64,900, I will exit my buy positions and immediately sell on the bounce. Before buying on a breakout, ensure that the 50-day moving average is below the current price and that the Awesome indicator is in the zone above zero.
- Scenario No. 2: I can buy Bitcoin from the lower boundary of $64,200 if there is no market reaction to its breakout in the opposite direction, targeting $64,500 and $64,900.
Sell Scenario
- Scenario No. 1: I plan to sell Bitcoin today when it reaches around $64,200, targeting a decline to $63,900. At around $63,900, I will exit my sell positions and immediately buy on the bounce. Before selling on a breakout, ensure that the 50-day moving average is above the current price and that the Awesome indicator is in the zone below zero.
- Scenario No. 2: I can sell Bitcoin from the upper boundary of $64,500 if there is no market reaction to its breakout in the opposite direction, targeting $64,200 and $63,900.
Ethereum
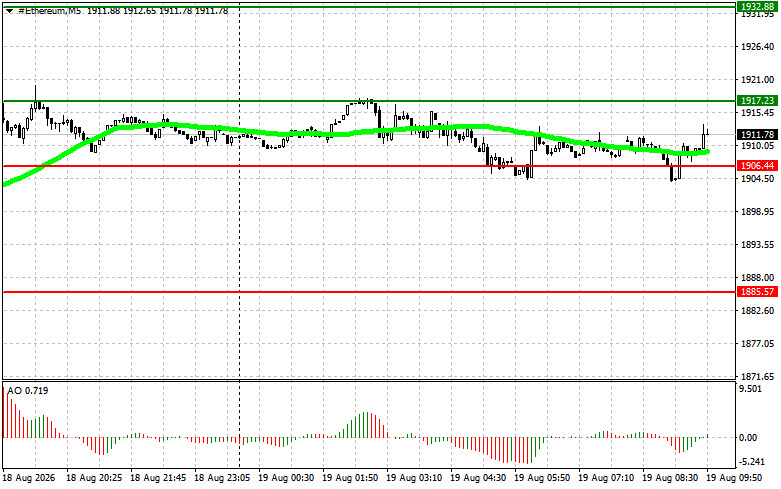
Buy Scenario
- Scenario No. 1: I plan to buy Ethereum today when it reaches around $1,917, targeting a rise to $1,932. At around $1,932, I will exit my buy positions and immediately sell on the bounce. Before buying on a breakout, ensure that the 50-day moving average is below the current price and that the Awesome indicator is in the zone above zero.
- Scenario No. 2: I can buy Ethereum from the lower boundary of $1,906 if there is no market reaction to its breakout in the opposite direction, targeting $1,917 and $1,932.
Sell Scenario
- Scenario No. 1: I plan to sell Ethereum today when it reaches around $1,906, targeting a decline to $1,885. At around $1,885, I will exit my sell positions and immediately buy on the bounce. Before selling on a breakout, ensure that the 50-day moving average is above the current price and that the Awesome indicator is in the zone below zero.
- Scenario No. 2: I can sell Ethereum from the upper boundary of $1,917 if there is no market reaction to its breakout in the opposite direction, targeting $1,906 and $1,885.
Смотрите также