Fear in crypto and stocks hits market hard

Crypto-currencies
2026-11-03 09:10:41
Bitcoin fell today to around $76,500 after yesterday's collapse in the tech sector, when the Nasdaq-100 erased its daily gain, turned negative and lost roughly $1 trillion of market cap in five hours. It closed the session down 1.4%, and the cumulative decline from the October high exceeded 10% — meaning the index entered a technical correction. This is the second such blow in three days: on Friday, the Nasdaq fell 2.86%, the Philadelphia semiconductor index plunged 7.2%, and intraday moves in Nasdaq-100 names wiped more than $1 trillion.
The link between tech and Bitcoin is now almost mechanical, channelled through doubts about the payback on AI spending. On Friday, Intel shares plunged nearly 30% after a weak outlook, while Marvell lost 12.72% on a $115-billion deal, and Oracle sold $10 billion each of equity and debt to finance AI infrastructure. More expensive borrowing by tech giants amplified rate fears, making a December Fed rate hike the market's base scenario. That is why Bitcoin is acting like a risk asset rather than a safe haven. Spot Bitcoin ETFs lost $399 million on Monday after $643.2 million of outflows on Friday — the largest daily outflow in October. Forced liquidations completed the picture: Ethereum sank below $2,250 and more than $100 million of longs were liquidated within an hour.
Fear & Greed indices confirm the market is on the defensive. The equity indicator at 23 sits in extreme-fear territory (the scale runs 0–25), while the crypto gauge at 26 remains in fear, just one point from the extreme zone. Earlier readings were 29–30 on October 30, when the index dropped 21 points in a single day from 51. Notably, in the three prior cases of similarly rapid index collapses, Bitcoin traded lower a month later — though the sample is too small to draw conclusions. Importantly, the index is calculated from Bitcoin's volatility and price momentum, so it primarily records falls rather than forecasting turnarounds.
The suspended situation around the midterms only heightens caution. Today decides all 435 House seats and 35 Senate seats; Republicans hold 53 of 100 Senate seats, and Democrats need a net gain of four. A simultaneous loss of control in both chambers for Republicans is no longer fanciful: prediction markets now price a 62% chance Democrats win both chambers.
I expect Bitcoin to first test 75,600 from below in the coming days; a close below 75,000 — widely regarded as key support — would open the door to a deeper drop. A rebound to 77,500 looks realistic only if semiconductors stabilise and the elections result in a split Congress without surprises in the Senate.
Bitcoin
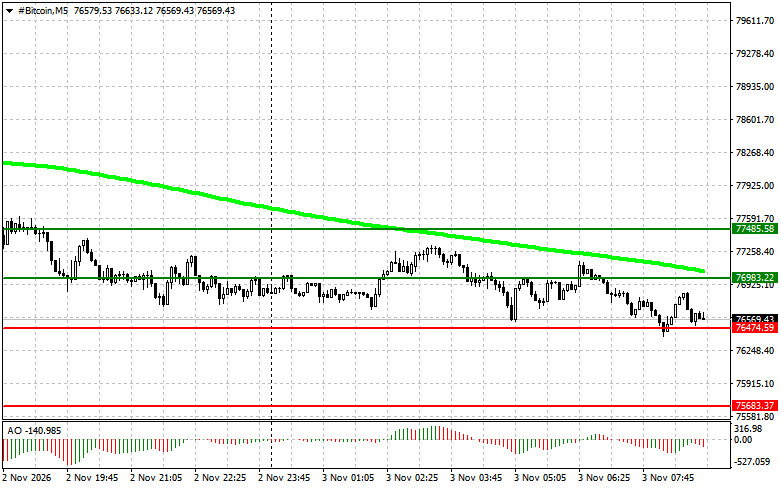
The current range runs between 76,400 (support) and 76,900 (resistance). The plan covers two mirror scenarios for breakouts and rejections. The buy setup requires a confirmed break above 76,900 while price trades above the 50-day MA and the Awesome Oscillator is above zero. The target is 77,500, where profits are taken, and a short on the pullback may be considered. If a break below 76,400 proves false, a buy from the lower boundary targets first 76,900 and then 77,500.
The sell logic is symmetrical. A confirmed break below 76,400, with the 50-day MA above price and Awesome below zero, opens a short targeting 75,600. If an upside break fails and price is rejected at 76,900, a short targets 76,400 and then 75,600.
Ethereum
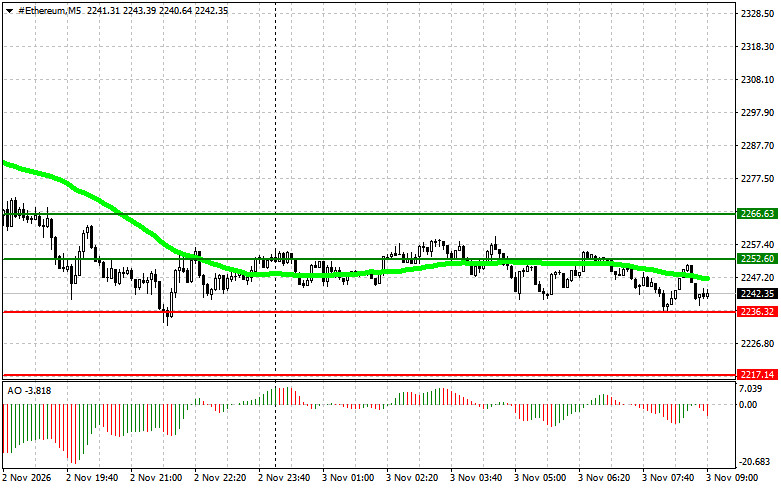
The logic mirrors Bitcoin on its own price scale. The range is 2,236 (support) to 2,252 (resistance). Buy on a confirmed break above 2,252, provided price is above the 50-day MA and Awesome > 0, with a target of 2,266 — take profit there and consider a short on the pullback. If a downside break below 2,236 is false, a buy from support aims first at 2,252, then 2,266.
Sell on a confirmed break below 2,236, when the MA is above price and Awesome < 0, targeting 2,217. If an upside breakout to 2,252 fails and price is rejected, a short from the top targets 2,236 and then 2,217. Both indicators are used as filters to weed out false moves, not as standalone entry triggers; trades are taken only after price confirms the specified levels.
Смотрите также