Largest outflow from Bitcoin ETFs since June — and why it matters

Crypto-currencies
2026-11-09 11:22:22
Bitcoin is trading around $74,000, having plunged sharply late yesterday. The clearest evidence of market weakness came from ETFs. Last week, US spot Bitcoin ETFs saw net outflows of $1.28 billion, the biggest weekly withdrawal since late June. Year-to-date, the funds are now down $919 million, whereas after the week of October 5–9 they were still up about $494 million. October closed with an outflow of $515 million, so November began with an even sharper acceleration.
Almost the entire hit fell on BlackRock's IBIT. The fund lost $1.21 billion — roughly 95% of the week's total. This was the sixth consecutive session of outflows; since October 30, about $1.44 billion has left IBIT. Fidelity's Wise Origin Bitcoin Fund gathered roughly $93 million over the week, despite nearly $200 million of outflows on Thursday. The beneficiary here is clear: Fidelity is capturing part of the flow from its main rival, while IBIT holders are the losers.
Reasons for the money moving out include a reassessment of US rate expectations, post-midterms uncertainty, weakness in tech stocks, and the $6.3 billion Binance hack. Given this backdrop, investors and traders are rethinking the odds of further crypto market gains through year-end — especially now that passage of the CLARITY bill appears unlikely.
The fear & greed index fell to 25. Earlier in October, the index ranged between roughly 38 and 57 by different sources, so this is a clear shift in sentiment toward fear.
The market is currently in a phase of "breakdown and search for a bottom" and is awaiting signals from US inflation data and the Fed. I believe ETF inflows are unlikely to return before Tuesday's CPI release, because the outflows accelerated on expectations of tightening. If funds continue to lose $200–300 million a day, the market will lack a buyer able to absorb sales by short-term holders whose positions are already underwater. I don't rule out that the IBIT outflow streak could end first in the event of soft inflation data — in that case Bitcoin could quickly return to $75,400 — but for now, further pressure and a test of $73,200 seem more likely.
Bitcoin
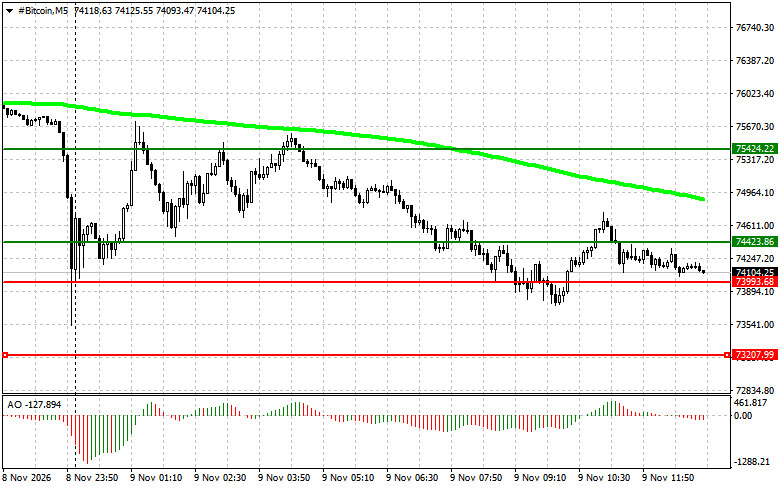
The near-term range lies between support at $73,900 and resistance at $74,400, and the plan centers on two mirrored directions with full breakout and pullback scenarios. Buys: a confident break above $74,400 opens the way to $75,400, where it makes sense to take profits and consider a short on the retrace; the conditions are price above the 50-day moving average and the Awesome Oscillator above zero. If price falls below $73,900, but the downside break fails, and buyers quickly reclaim the level, a buy is acceptable, targeting first $74,400 and then $75,400.
Sells are mirrored: a close below $73,900 with confirmation gives a short targeting $73,200, provided the 50-day MA is above price, and the Awesome Oscillator is below zero. If price rises to $74,400 but the breakout up does not hold, consider a short back to $73,900 and then $73,200.
Ethereum
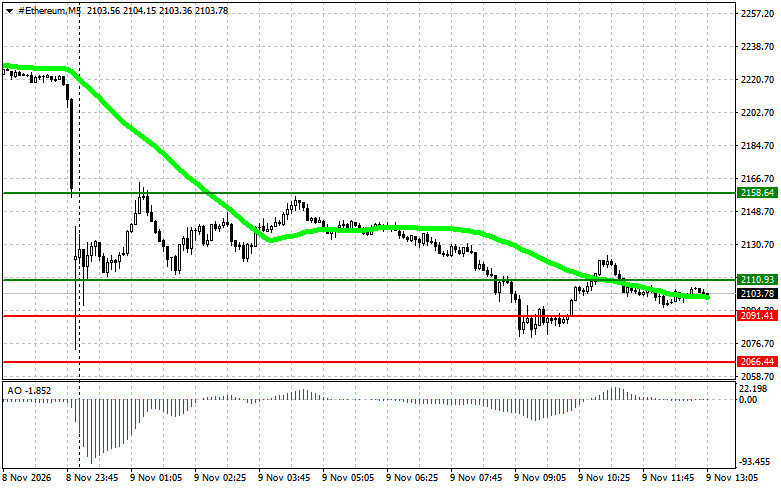
The logic mirrors Bitcoin on its own price scale: the working range is between support at $2,091 and resistance at $2,110. A breakout above $2,110, with price above the 50-day MA and Awesome above zero, signals a buy with a target of $2,158, where profits should be taken and short positions considered on a retrace; a false drop below $2,091 followed by a quick reclaim opens a buy first to $2,110 and then $2,158.
Смотрите также