Bitcoin trading recommendations (ICT) on November 20
Crypto-currencies
2026-11-20 05:37:53
Bitcoin continues to fall and has lost about $22,000 in the current leg. There are no signs the decline is over. We are not surprised by this development, because we have repeatedly said the downtrend cannot be considered finished and Bitcoin is still inside the daily timeframe sideways channel. As for fundamentals, we do not see a single factor at present that would support Bitcoin, cryptocurrencies, and risk assets. Thus, we continue to expect further declines and do not understand on what basis Bitcoin should suddenly start a bull trend.
In our FX articles we regularly note that the dollar's rise is somewhat illogical, and the market ignores factors that argue against the U.S. currency. In short, the market buys the dollar regardless of the evidence. However, in Bitcoin's case the current decline is entirely natural. First, the technical picture argues for a decline: the weekly TF remains bearish, and on the daily TF, an upper boundary deviation of the sideways channel was formed. Second, the Fed keeps intensifying its hawkish stance. In the dollar's case the market ignores most other factors and focuses on the Fed, but for Bitcoin that factor comes to the fore and is reinforced by many other negatives stacked against digital gold.
Third, Bitcoin usually falls after U.S. midterms. Fourth, the Congress turning "blue" means the crypto sector's prospects materially deteriorate. Fifth, almost every week we hear reports of major hacks and thefts of digital assets; AI greatly simplifies hackers' work, and quantum threats grow day by day. Sixth, spot demand for Bitcoin remains weak. Seventh, U.S. ETF instruments have seen outflows for most of 2026. Eighth, the AI sector now looks much more attractive to many investors. Ninth, the Clarity Act was not passed. Bitcoin is approaching the $57,500–$60,200 area where a reversal could occur. However, that does not mean Bitcoin must reverse in that zone.
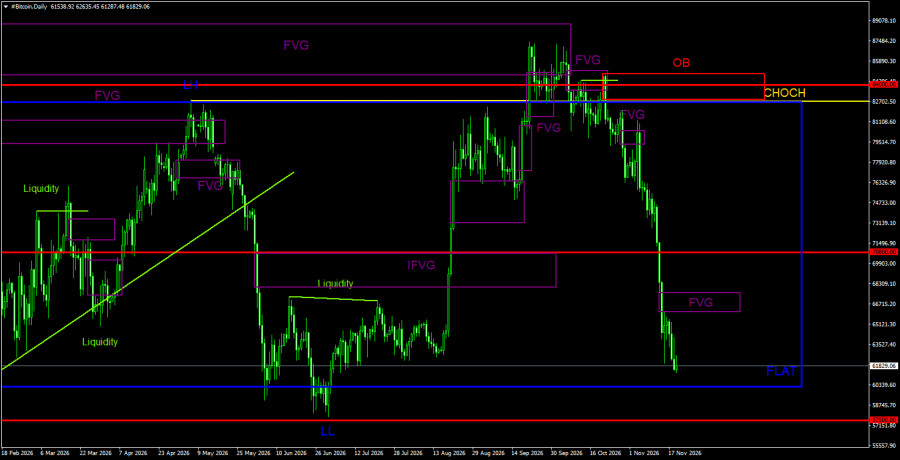
General BTC/USD picture on 1D
On the daily, TF Bitcoin remains in the wide sideways channel $60,000–$82,500. Price formed a deviation of the channel's upper boundary, which, combined with reactions to two bearish FVGs, triggered a powerful drop to the lower boundary of the sideways channel. On the way down, Bitcoin corrected to the nearest bearish FVG and received a clear reaction that produced a new sell signal. Last week another bearish FVG formed, but it appeared already in the lower part of the channel, so the reaction to it may be weak. Recall that inside a flat all patterns are weak. Expect the crash to conclude only near the channel's lower boundary or around $57,500.
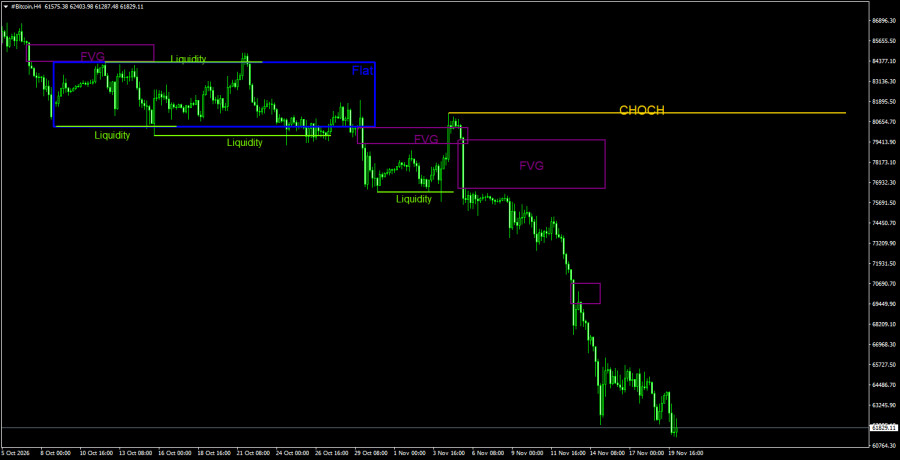
General BTC/USD picture on 4H
On the 4-hour timeframe, the formation of a bearish structure continues. The CHOCH line currently sits at $81,200. On the daily TF all necessary sell reversal signals were produced, allowing traders to open short positions in advance. Bitcoin's targets are best defined by the daily sideways channel, which, in our view, remains relevant. On the 4-hour TF, Bitcoin reacted to the latest bearish pattern. It is best to orient by the daily chart now, because the move is very strong.
Trading recommendations for BTC/USD:
Bitcoin attempted to start a new uptrend in summer, but the fundamental backdrop, spot demand, and recent news proved too negative to expect continuation. Price formed a deviation of the flat's upper boundary and reacted to three bearish FVGs. Therefore, a fall to the lower boundary of the sideways channel is more than plausible. Short positions remain relevant in the near term with targets at $60,200 and $57,500. The new bearish FVG on the daily chart may provide traders another opportunity to enter the market with short positions. Around $60,200 and $57,500, a reversal up is possible, but talk of the start of a bull trend is still premature. If the price bounces at $60,200 or $57,500 and bullish patterns form, longs can be considered within the same sideways channel.
Illustration notes:
CHOCH—change of trend structure.
Liquidity—liquidity, stop losses, and pending orders that market makers use to build positions.
FVG—fair value gap. A price inefficiency area that price traverses quickly, indicating the absence of one side of the market; thereafter price tends to return and react to such areas in continuation of the main trend.
IFVG — inverted fair value gap. After returning to such an area, the price often does not react but impulsively breaks through and then tests from the other side.
OB — order block. The candle where a market maker opened a position aiming to take liquidity to form a position in the opposite direction.
Смотрите также