BTC/USD Analysis – March 11th: Has Bitcoin's Decline Ended?
Crypto-currencies
2025-03-11 07:39:25
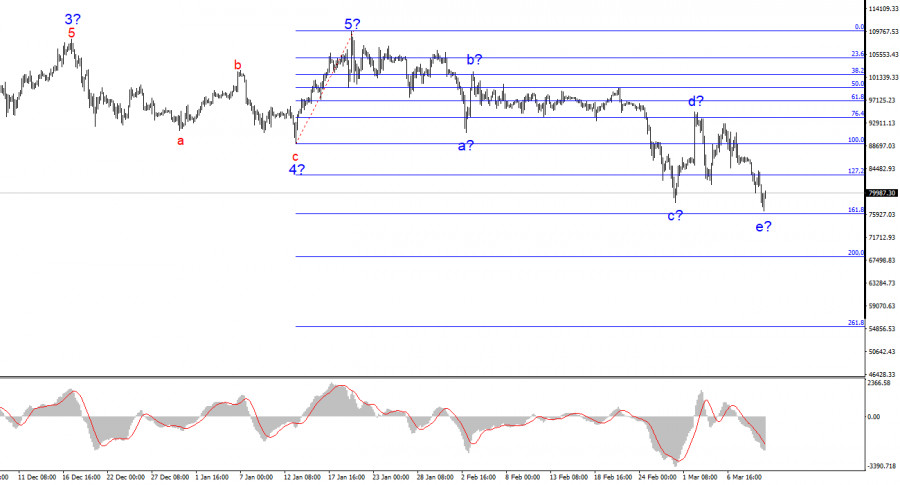
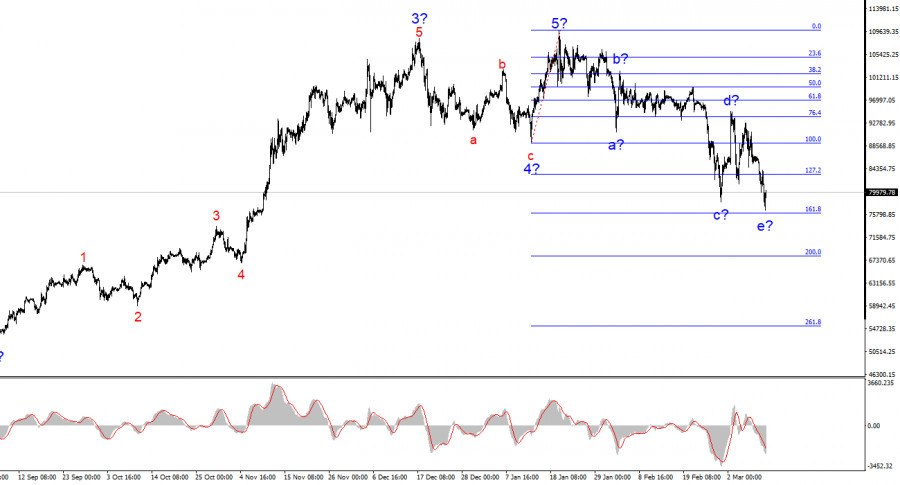
The wave structure on the 4-hour BTC/USD chart is quite clear. Following the completion of a five-wave bullish trend, the market has entered a downward phase, which currently appears to be a corrective wave. Based on this, I did not and do not expect Bitcoin to rise above $110,000 – $115,000 in the coming months.
The news cycle previously supported Bitcoin's growth, fueled by continuous institutional investments, participation from government entities and pension funds. However, Trump's policies have driven investors out of the market, and a trend cannot remain bullish indefinitely. The wave that began on January 20 does not resemble an impulse wave, indicating a complex corrective structure that could last for months. The internal structure of this first wave is complicated and ambiguous. It is crucial to remember that wave analysis should be as simple and clear as possible for effective trading.
Over the past five days, BTC/USD has fallen by $12,000. While this may seem significant, a $2,500 daily drop is not particularly extreme for Bitcoin. However, Bitcoin has been declining for two months, coinciding remarkably with Donald Trump's return to power in the U.S. While it is unrealistic to expect Bitcoin to keep falling for the next four years, market participants lack optimism regarding the "global cryptocurrency capital" narrative.
Trump may talk about creating a National Cryptocurrency Reserve, loosening regulations, and supporting the crypto sector, but the market needs concrete actions and real improvements. Moreover, even if these positive changes occur, the trend cannot always be bullish.
Currently, the latest downward wave has taken a five-wave structure, suggesting that it may be near completion, or could end around the $76,000 level, which corresponds to 161.8% Fibonacci retracement. If this assumption holds true, a new set of bullish waves (or a single corrective wave) could begin from current levels. I assume that the price action from January 20 until now represents a global "A" wave of a larger trend segment. This means that Bitcoin's decline is not over yet, but it may pause before resuming later.
Key Takeaways
Based on my BTC/USD analysis, I conclude that the current bullish phase has ended. The market is now entering a complex, multi-month correction. I have previously advised against buying Bitcoin, and I continue to discourage long positions. A decline below the low of Wave 4 signals the formation of a broader downtrend, which is likely corrective in nature.
Thus, the best approach remains to look for selling opportunities. Bitcoin could fall to $76,000 (161.8% Fibonacci) and possibly $68,000 (200% Fibonacci) in the coming weeks. However, a short-term corrective rebound is also possible, providing new opportunities to short Bitcoin.
On higher timeframes, Bitcoin has completed a five-wave bullish cycle, and we are now witnessing the formation of either a corrective bearish phase or a fully-fledged downward trend.
Core Principles of My Analysis
- Wave structures should be simple and clear. Complicated structures are difficult to trade and often require adjustments.
- If there is uncertainty in the market, it is better to stay out.
- No market direction is ever 100% certain. Always use Stop Loss orders for risk management.
- Wave analysis should be complemented with other analytical methods and trading strategies.
Смотрите также