Trading Recommendations for Bitcoin on August 20 According to the ICT System
Crypto-currencies
2026-08-20 03:57:28
Bitcoin continues to correct and has recently soared to $4,500. While this is not extremely strong growth for the first cryptocurrency, it is still an increase. Ultimately, Bitcoin reached the only area of POI (Point of Interest) in the form of a "bearish" FVG after a two-month delay. What can we expect next? In our view, despite Bitcoin's strong growth on Wednesday, the downward trend that began last year remains intact. Therefore, the current rise is likely part of a correction or even a market-maker manipulation to signal to the market that a new "bullish" trend is beginning. However, we still see no grounds or signs of a bullish trend. The fundamental backdrop remains negative for the cryptocurrency segment: the Federal Reserve does not intend to lower the key rate in 2026, capital continues to flow into the AI sector, spot demand for Bitcoin remains weak, geopolitical tensions are unstable, miners are repurposing their equipment for AI needs, and Strategy continues to sell Bitcoin reserves. Thus, we see no reason for a significant rise in "digital gold."
Meanwhile, it became known that Strategy raised over $300 million through the sale of preferred shares, but for the first time in a long time, it did not spend a single dollar on buying Bitcoin. Recall that for the past six years, Strategy has primarily focused on buying "digital gold" with all its available funds. This strategy has led to significant unrealized losses (because the current price of the first cryptocurrency is well below the Strategy's average purchase price) and liquidity problems. As a result, the company's management has decided to start selling "digital gold." Thus, the funds raised are now directed toward replenishing dollar reserves, paying dividends, or repurchasing shares. It should also be noted that the change in Strategy's approach has not led to a significant rise in its stock price; for example, the preferred shares are still trading below their par value. The company continues to hold approximately 840,000 coins, but we believe that over time, Bitcoin reserves will be reduced.
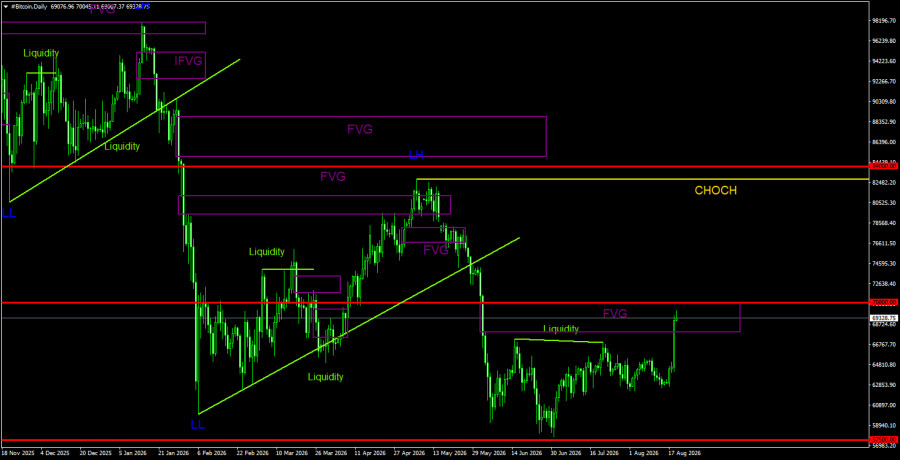
Overall Picture of BTC/USD on 1D:
On the daily timeframe, Bitcoin continues to form a downtrend. The trend structure is identified as bearish, and the CHOCH (Change of Character) line is at $82,800, indicating that a new LL (Lower Low) has been formed. Only above this level can it be said that the downward trend is over. Since there are still no signs of an upward trend reversal, we believe the decline will resume once the current correction ends. A bearish FVG formed in the area of $68,000–$70,700 serves as the only POI for sales. Currently, this pattern has been processed, and the price has removed liquidity from two previous highs. Therefore, a strong sell signal may be formed in the coming days. If this pattern shows no reaction, we could discuss the potential onset of a bullish trend.
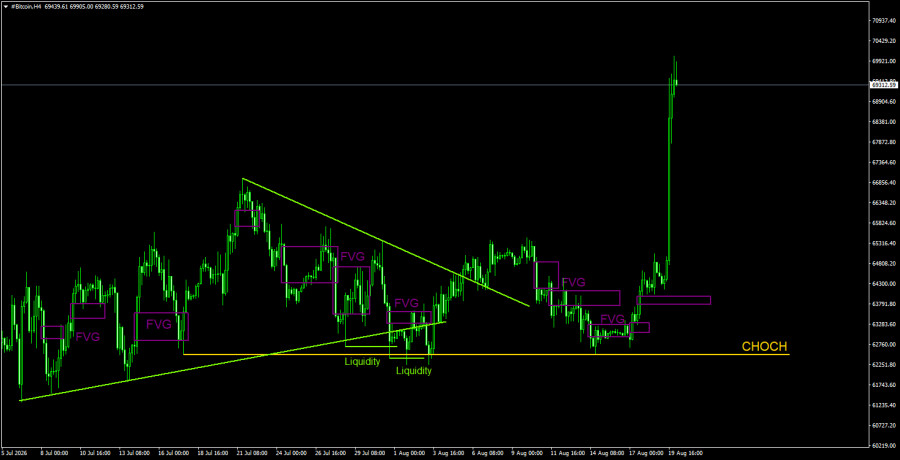
Overall Picture of BTC/USD on 4H:
On the 4-hour timeframe, it is clear that Bitcoin has experienced significant upward movement. Analyzing the 4-hour timeframe at this time makes little sense, as the key pattern has been executed on the daily chart and liquidity has been removed. Therefore, signals in the coming days should be sought on the daily timeframe. It's worth reminding that the signal should have confirmation on a timeframe two levels lower than the current one. However, to see a break in the upward trend on the hourly timeframe requires a very strong decrease. Thus, the chances of Bitcoin falling are currently very high, but one should proceed cautiously.
Trading Recommendations for BTC/USD:
Bitcoin continues to form a full-fledged downward trend. We expect a decline toward $57,500 (the 61.8% Fibonacci level of the three-year upward trend), although this level has already been tested. However, we do not consider the downward trend to be over. The last bearish FVG formed in the $68,000–$70,700 range on the daily timeframe, so this area serves as the POI for short positions in the coming weeks. In the coming days, this pattern will either be negated or provide an excellent sell signal.
Explanations for the Illustrations:
- CHOCH – Change of Character in trend structure.
- Liquidity – Liquidity, stop losses, pending orders that market makers use to accumulate their positions.
- FVG – Fair Value Gap. Price moves very quickly through such areas, indicating a complete absence of one side in the market. Prices tend to return to such areas and react in the direction of the main trend.
- IFVG – Inverted Fair Value Gap. After returning to such an area, the price does not receive a reaction but impulsively breaks through and then tests it from the opposite side.
- OB – Order Block. A candle on which the market maker opened a position to gather liquidity to form its own position in the opposite direction.
Смотрите также