Trading Recommendations for the Cryptocurrency Market on August 20

Crypto-currencies
2026-08-20 07:56:26
Bitcoin soared to around $70,000 yesterday, while Ethereum reached $2,300. This was due to actions by the US Treasury, which announced a hidden QE program aimed at reducing bond yields.
Against this backdrop, the rally initiated the day before by the US Treasury's decision to double its buyback of long-term bonds gained even more momentum in the past 24 hours. The total capitalization of the cryptocurrency market increased by 7.5% to $2.45 trillion, and according to CoinGlass, positions worth $2.98 billion were liquidated in 24 hours, of which $2.74 billion were short positions and only $242 million long positions.
Shorts accounted for about 92% of the total liquidation volume, and over 173,000 traders were affected during this period, with the largest single position liquidated at $48.8 million for BTC-USD coming from Hyperliquid.
The Fear and Greed Index made a swift turnaround, rising to 62 points in the greed zone compared to 46 the day before and just 29 a week ago. A month ago, the indicator was in the extreme fear zone at 25. Technically, Bitcoin returned above the 200-day moving average, an important signal of weakening bearish pressure.
An important caveat concerns the nature of the movement itself. Over $1 billion in short positions were liquidated within just one hour at the peak of volatility, indicating that a significant part of the immediate rise was driven by forced buying demand rather than a fresh organic influx of capital. A key test will be the market's ability to hold the broken levels once the short-squeeze effect has exhausted itself.
Regarding short-term trading, the strategy and conditions are described below.
Bitcoin
Buying Scenario
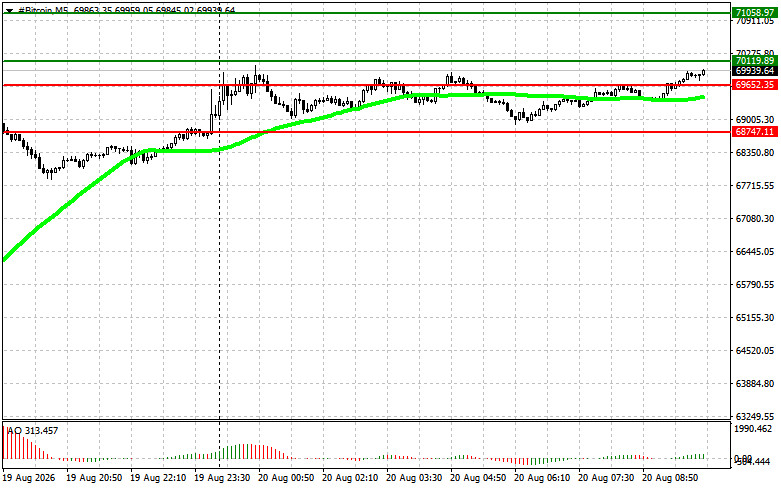
Scenario #1: I will buy Bitcoin today when the entry point reaches around $70,100, targeting a rise to the level of $71,000. At around $71,000, I will exit my buy positions and sell immediately on a pullback. Before buying on the breakout, ensure that the 50-day moving average is below the current price, and the Awesome indicator is in the zone above zero.
Scenario #2: Bitcoin can be bought from the lower boundary of $69,600 if there is no market reaction to its breakdown in the opposite direction to levels of $70,100 and $71,000.
Selling Scenario
Scenario #1: I will sell Bitcoin today when the entry point reaches around $69,600, targeting a drop to $68,700. Around $68,700, I will exit my sell positions and buy immediately on the pullback. Before selling on the breakout, ensure that the 50-day moving average is above the current price, and the Awesome indicator is in the zone below zero.
Scenario #2: Bitcoin can be sold from the upper boundary of $70,100 if there is no market reaction to its breakdown in the opposite direction to levels of $69,600 and $68,700.
Ethereum
Buying Scenario
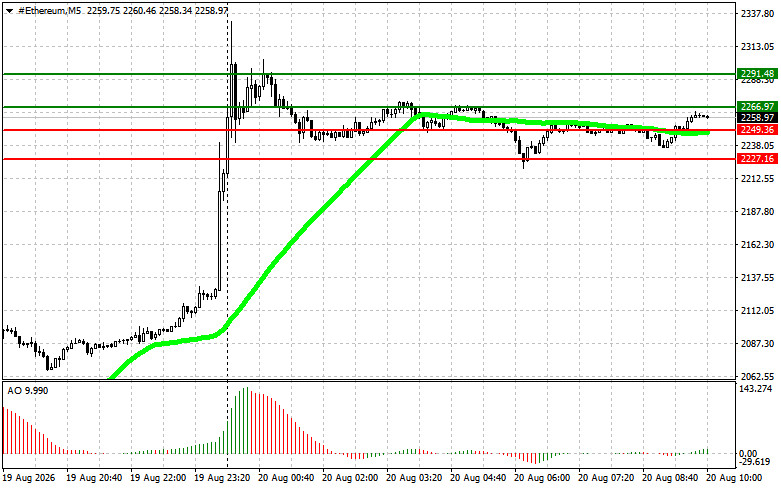
Scenario #1: I will buy Ethereum today when the entry point is around $2,266, targeting a rise to $2,291. At around $2,291, I will exit my buy positions and sell immediately on a pullback. Before buying on the breakout, ensure that the 50-day moving average is below the current price, and the Awesome indicator is in the zone above zero.
Scenario #2: Ethereum can be bought from the lower boundary of $2,249 if there is no market reaction to its breakdown in the opposite direction to levels of $2,266 and $2,291.
Selling Scenario
Scenario #1: I will sell Ethereum today when the entry point reaches around $2,249, targeting a drop to $2,227. Around $2,227, I will exit my sell positions and buy immediately on the pullback. Before selling on the breakout, ensure that the 50-day moving average is above the current price, and the Awesome indicator is in the zone below zero.
Scenario #2: Ethereum can be sold from the upper boundary of $2,266 if there is no market reaction to its breakdown in the opposite direction to levels of $2,249 and $2,227.
Смотрите также