Bitcoin jumps 9% after US Treasury doubles bond buybacks

Crypto-currencies
2026-08-20 09:53:11
Bitcoin made its largest daily move since March 4, surging from an intraday low of about $64,100 to a peak near $69,700. The gain reached up to 8.7%, and Ethereum broke above $2,300 for the first time since June, rising as much as 13%. The catalyst was a US Treasury decision announced on August 19 to at least double the size of its long?term bond buyback operations — from $2 billion to no less than $4 billion per operation — starting September 9 and running through November 4, covering the 10–20 and 20–30-year securities.
The move followed a sharp rout in the bond market that had pushed 30-year US Treasury yields to 5.34% on Tuesday, a high not seen since 2007, amid fears of a rapid escalation in the US–Israel–Iran conflict and growing concerns about the fiscal state of the country — US total government debt topped $40 trillion the same day.
Market mechanics followed standard macro logic. After the buyback announcement, the 30-year yield eased to about 5.19% and the 10-year to 4.65%, the dollar index fell 0.8%, and together this reduced the opportunity cost of holding bitcoin as a non-yielding asset. The move was amplified by a wave of forced liquidations that hit traders positioned against the market especially hard.
According to CoinGlass, more than $1.2 billion of positions were liquidated in a single hour, and over 110,000 traders lost about $1.45 billion in total for the day; short positions accounted for roughly $1.29 billion of that. On the same day, the SEC formally proposed the "Crypto Assets Regulation" package reported earlier, and the coincidence of two positive headlines pushed some crypto equities up as much as 10% and further fueled the liquidation cascade.
It is important to note how Treasury buybacks differ from Fed quantitative easing. The Treasury emphasized that the operation does not create new bank reserves: it is a repurchase of already?issued old debt using existing funds, not fresh money creation, and the scale of the increase is modest relative to the $32.2 trillion Treasury market.
The sharpness of the move is explained by the context of recent weeks. On that backdrop, VanEck had, the day before the announcement, registered 8 out of 12 capitulation signals, calling the market in a late-stage drawdown with a possible shift to accumulation already in September, while Glassnode recorded record-low spot trading volumes — the kind of thin liquidity that allows even a moderate macro signal by historical standards to trigger a disproportionately large price move.
Notably, even after the surge, Bitcoin remains roughly 45–49% below its October 2025 peak above $126,000, and the key date for judging the durability of the effect will be November 4, when the Treasury will decide whether to keep the increased buyback pace, expand it or roll it back.
Trading recommendations
Bitcoin
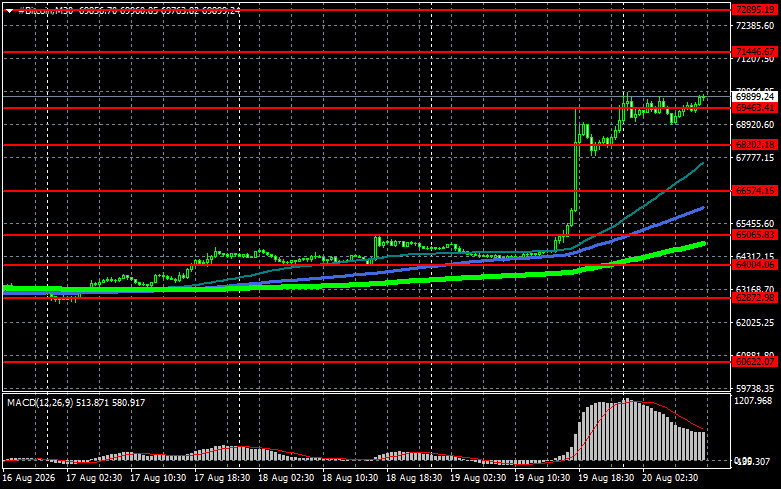
Buyers are currently targeting a return to $71,400, which opens a direct path to $72,900 and then to $74,300; a break above $74,300 would signal attempts to restore the bull market. On a pullback, buyers are expected at $69,400. A move below that area could quickly drop BTC toward $68,200. The farthest target would be the $66,500 area.
Ethereum
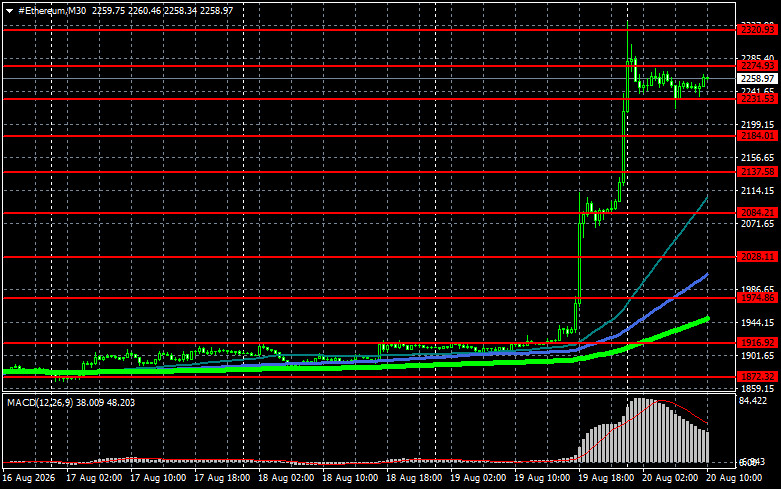
A clear hold above $2,274 opens a direct path to $2,320. The farthest target is the high around $2,373; a break above that would indicate strengthening bullish sentiment and a return of buyer interest. On a decline, buyers are expected at $2,231. A move below that area could quickly push ETH toward $2,184. The farthest target would be the $2,137 area.
What's on the chart
- The red lines represent support and resistance levels, where the price is expected to either pause or react sharply.
- The green line shows the 50-day moving average.
- The blue line is the 100-day moving average.
- The lime line is the 200-day moving average.
Price testing or crossing any of these moving averages often either halts movement or injects fresh momentum into the market.
Смотрите также